


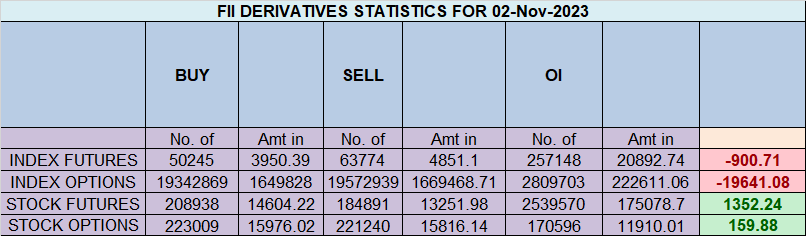
Analysis of FIIs’ behavior in the Nifty Index Futures market shows a Bearish approach as they displayed a preference for SHORT positions. On a net basis, FIIs went SHORT 744 contracts worth 72 crores, resulting in an increase of 8452 contracts in the Net Open Interest.
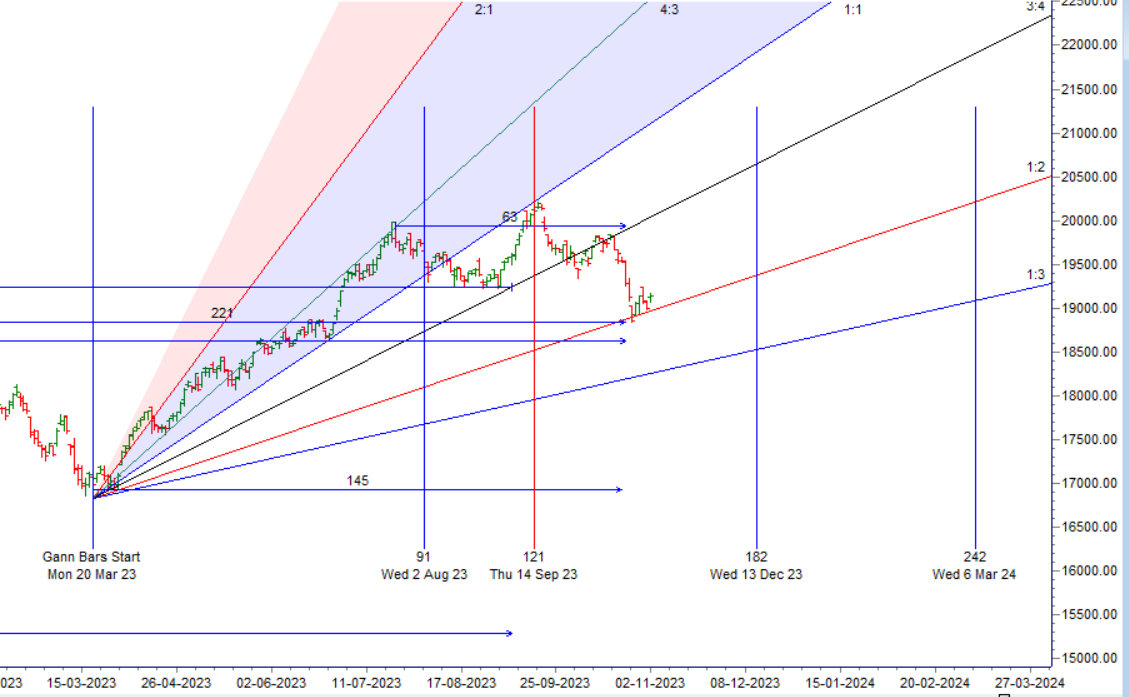
Price is back towards Gann angle, 01 Nov High is 19096 and Low is 18973. Break of any side will lead to a move of 233-323 points as Saturn and Jupiter made an Astro aspect yesterday. We will open gap up today BUlls need to sustain above 19100 for a Bullish expiry.
Nifty formed another DOJI and Price has closed above 01 Nov High @19096 , Till Bulls are holding above 19096 Nifty can see rally towards 19343-19410. Today Bayer Rule 9: Big changes on market are when Mercury passes over 19 degrees 36 minutes of Scorpio and Sagittarius,also over 24 degrees 14 minutes of Capricorn. will also become active and Saturn going direct on 04 Novemeber. So carry overnight positions with Hedge.
Nifty Trade Plan for Positional Trade ,Bulls will get active above 19112 for a move towards 19181/19249 . Bears will get active below 19043 for a move towards 18945/18906 — Waiting for 19249/19323.
Traders may watch out for potential intraday reversals at 9:51,11:47,12:24,1:16,2:15 How to Find and Trade Intraday Reversal Times
Nifty Nov Futures Open Interest Volume stood at 1.17 lakh cr , witnessing a addition of 2.3 lakh contracts. Additionally, the increase in Cost of Carry implies that there was a addition of LONG positions today.
Nifty Advance Decline Ratio at 41:09 and Nifty Rollover Cost is @19372 closed below it.
Nifty closed above 20/50/100 SMA 19100 should be watched, above it bulls will have strenght.

Nifty options chain shows that the maximum pain point is at 19100 and the put-call ratio (PCR) is at 0.80. Typically, when the PCR open interest ranges between 0.90 and 1.05, the market tends to remain range-bound.
Nifty 50 Options Chain Analysis
The Nifty 50 options chain indicates that the highest open interest (OI) on the call side is at the 19200 strike, followed by 19100 strikes. On the put side, the highest OI is at the 19000 strike, followed by 18900 strikes. This suggests that the market participants are expecting Nifty 50 to remain range between 19000-19200 levels.Total Call OI is 6.95 cr and Total Put OI is 7.58 cr
In the cash segment, Foreign Institutional Investors (FII) sold 1261 crores, while Domestic Institutional Investors (DII) bought 1380 crores.
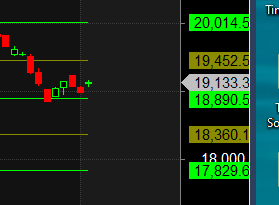
Traders who follow the musical octave trading path may find valuable insights in predicting Nifty’s movements. According to this path, Nifty may follow a path of 18890-19452-20014 This means that traders can take a position and potentially ride the move as Nifty moves through these levels.Of course, it’s important to keep in mind that trading is inherently risky and market movements can be unpredictable.Price has closed below 19452 heading towards 18890
Just give up the idea that we can figure it out! Listen to the market shout a very clear and unmistakable direction to us. All we have to do is listen, feel, and follow the marketís signals and not hope the market follows our lead. Rest assured. It wonít!
For Positional Traders, The Nifty Futures’ Trend Change Level is At 19121 . Going Long Or Short Above Or Below This Level Can Help Them Stay On The Same Side As Institutions, With A Higher Risk-reward Ratio. Intraday Traders Can Keep An Eye On 19205, Which Acts As An Intraday Trend Change Level.
Nifty Intraday Trading Levels
Buy Above 19200 Tgt 19225 , 19255 and 19300 ( Nifty Spot Levels)
Sell Below 19130 Tgt 19100, 19075 and 19035 (Nifty Spot Levels)
Wishing you good health and trading success as always.As always, prioritize your health and trade with caution.
As always, it’s essential to closely monitor market movements and make informed decisions based on a well-thought-out trading plan and risk management strategy. Market conditions can change rapidly, and it’s crucial to be adaptable and cautious in your approach.