


Gann Precision Zones: Master Swing Trading with Laser-Focused Levels!
📊 Level Up Your Swing Trading with Gann Precision Zones!
Built on Gann’s Price Action Studies and the Natural Laws of Vibration, this TradingView indicator is a game-changer for positional traders seeking high-accuracy trade setups with clear entry and exit points.
🔹 Why Traders Love Gann Precision Zones:
✅ Purple & Red Levels – Spot high-probability trade initiation & target zones 🎯
✅ Black Levels – Set precise stop-loss & trailing SL for risk-free execution 🔥
✅ Ideal for Swing & Positional Trading in stocks, indices, and commodities 📈
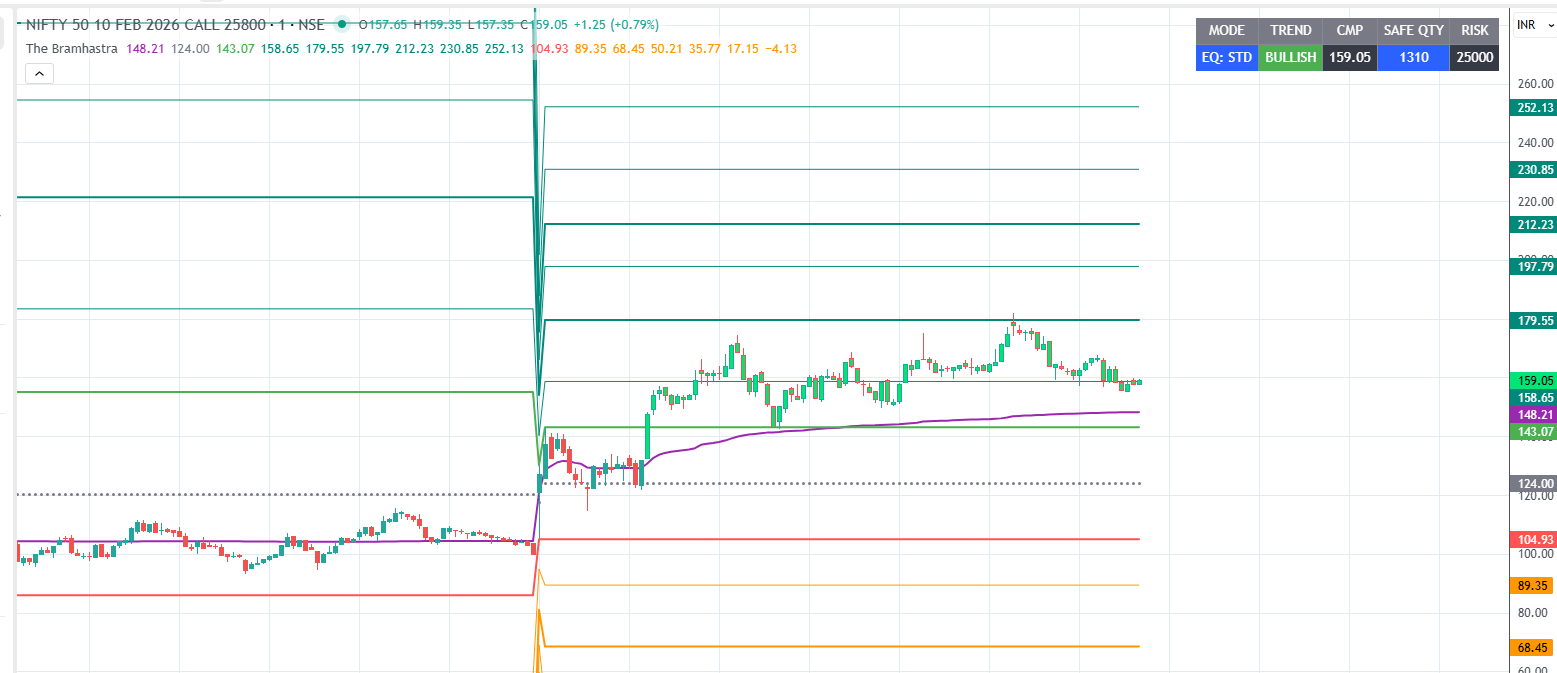
The Bramhastra : The Ultimate Tool for Options Trading!

Gann Momentum Analyzer: Elevate Your Trading Strategy with Precision Levels!
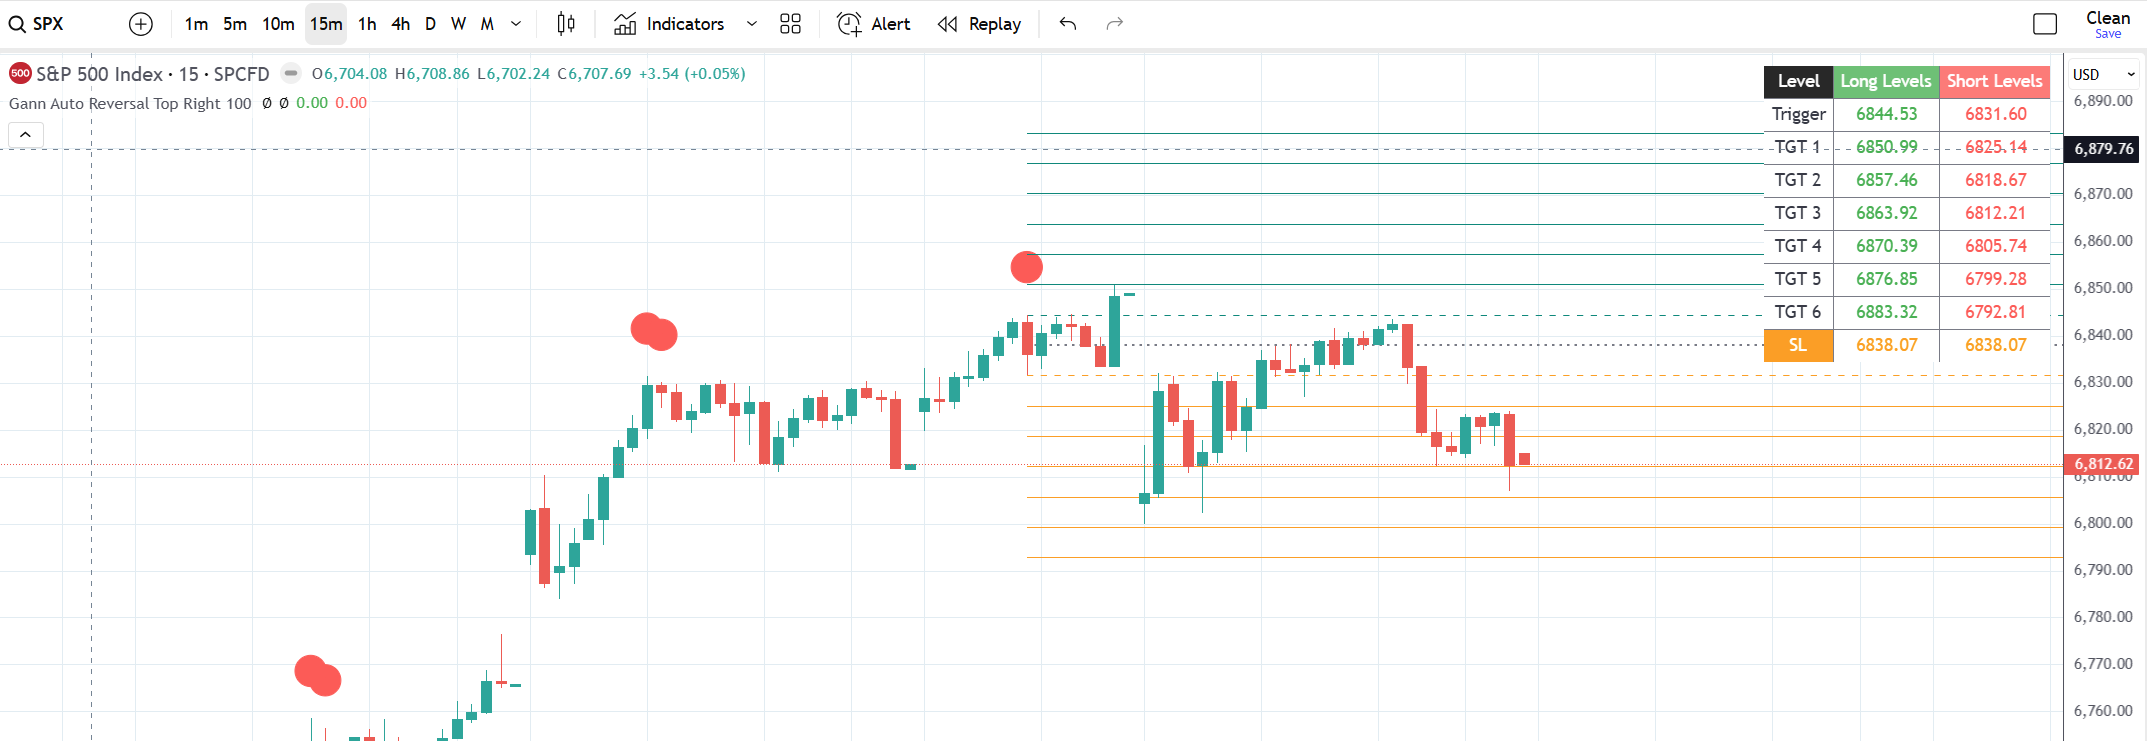
Gann Apex Reversal Suite: Master the Markets with Precision!

Gann Harmonic Vibrations: Tune into Market Frequencies! 📈

Gann Harmonic Opens: Unlock Your Trading Potential! 📈

Expiry Range Indicator: How to Use it for Profitable Trading on TradingView
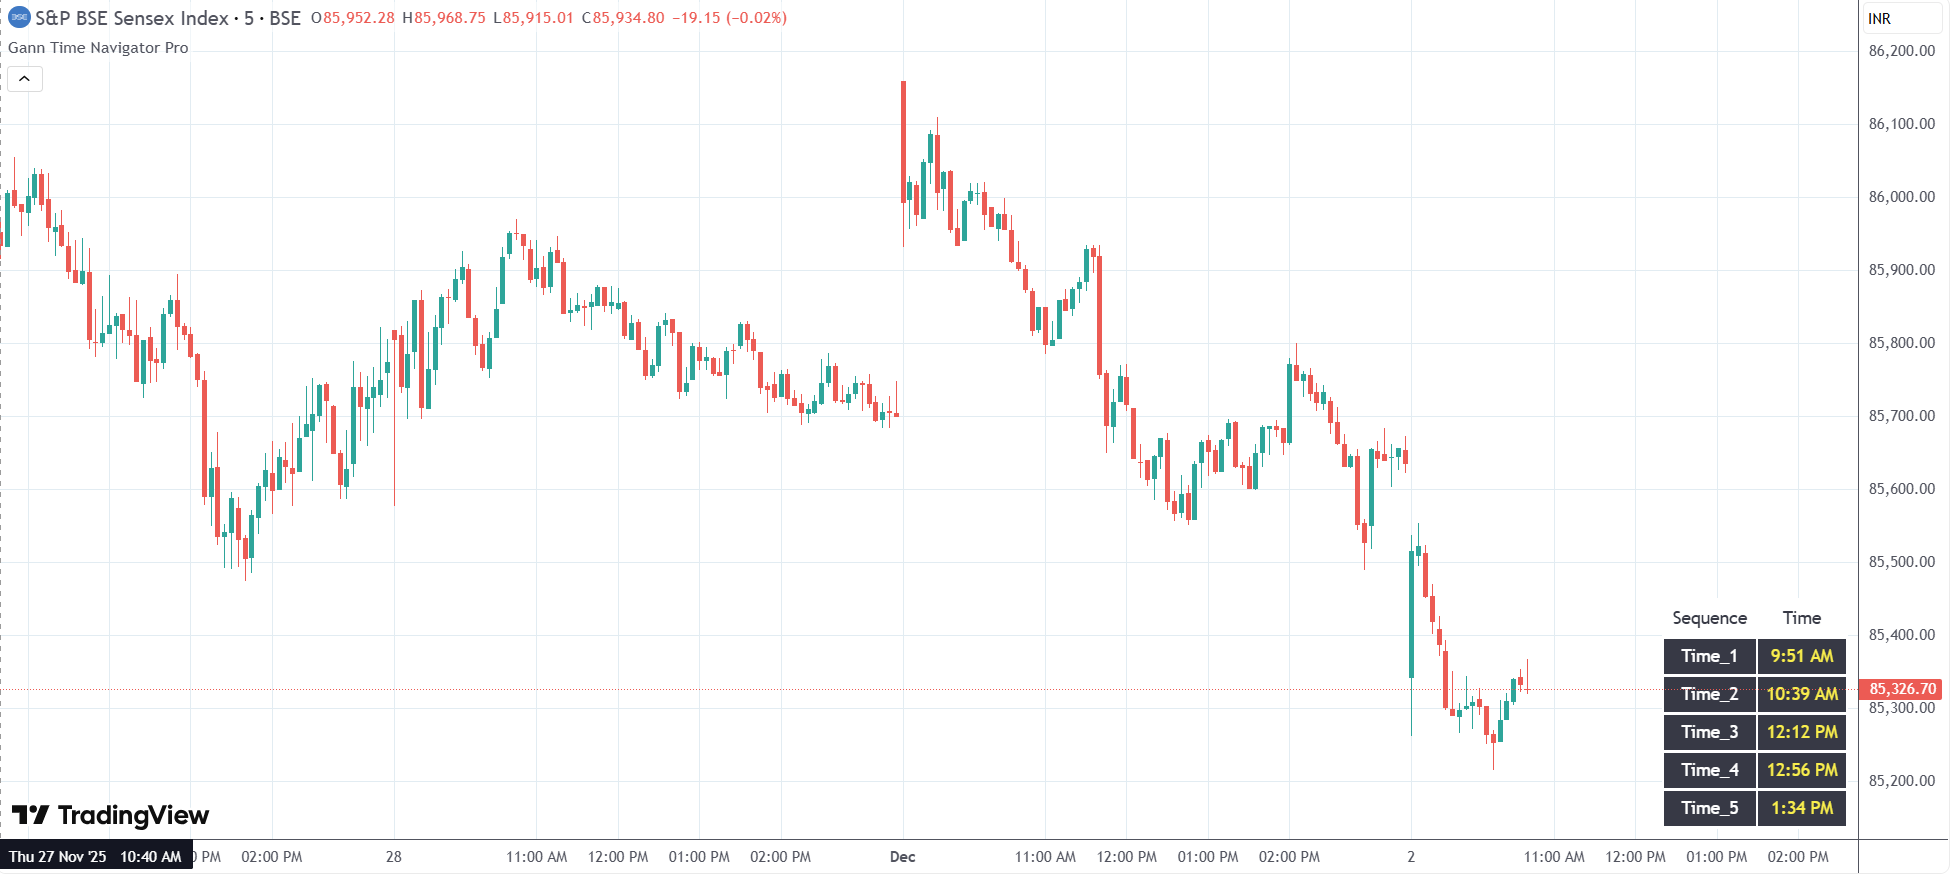
Gann Time Navigator Pro : How to Use it for Precise Trading on TradingView

AstroCycle Pro: Master Intraday Reversals with Mercury & Moon Cycles!

Gann Turbo Cycles: Master High-Speed Scalping with Dynamic Time Signals!

Gann Time Pulse: Intraday Trend Predictor!

Gann Intraday Pro: The Ultimate Intraday Trading Indicator for Precision Entries!

Astro Scalper X: Trade with Cosmic Precision Using Astro Levels!
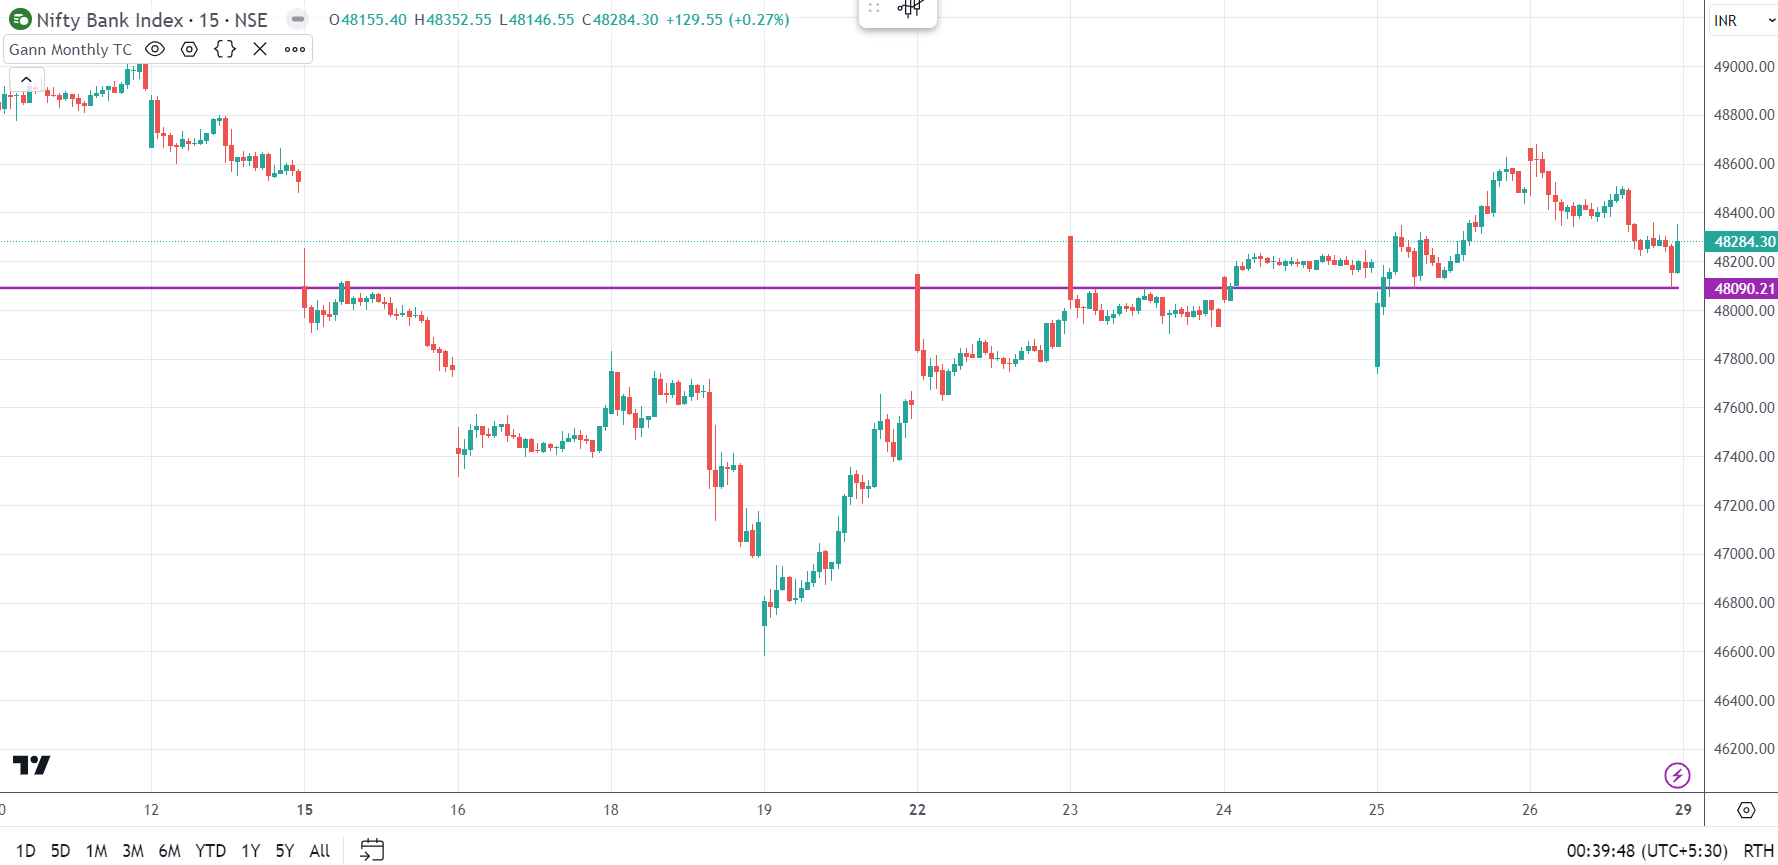
Gann Mega Trend X: Monthly Trend Change Levels for Profitable Swing Trading!

SAP Swing Master: Unlocking Trend Change Levels for Profitable Swing Trading!

Gann Annual Pulse: Mastering Trend Change Levels for Swing Trading Success!
Gann Wave Levels: Mastering Dynamic Support & Resistance for Intraday & Swing Trading!
