


The trading session on 18 May 2026 was forged in a crucible of intense institutional volatility. Bank Nifty carved out a massive 966-point intraday range, opening gap-down on global cues to test an absolute low of 52,767 before staging a fierce responsive recovery to settle down a minor 139.6 points at 53,533.80.
While surface-level observers see a bearish session, the underlying tape reveals a profound deception: a classic “Flush-and-Pin” operation designed to trap weak shorts before the next macro sequence unfolds.
1. The Institutional Footprint: Stealth Long Accumulation
Headline numbers suggest that Foreign Institutional Investors (FIIs) maintained their bearish posture by shorting 827 contracts worth 132 crore. However, the true story lies in the net Open Interest (OI) reduction of 631 contracts. FIIs did not build aggressive overnight shorts into the panic; they simply day-traded the massive swings.
Concurrently, Bank Nifty May Futures Open Interest expanded to 21.5 lakh contracts with an addition of 32,000 contracts. Crucially, this expansion was accompanied by an Increase in the Cost of Carry, a definitive metric confirming the structural addition of LONG positions by heavy-money domestic participants.
With an Advance-Decline ratio of 05:09, the market was highly polarized, yet the index held firm above key historical rollover baselines, demonstrating that institutional hands were quietly absorbing the retail distress at lower levels.
2. Astro-Gann Space & Time Synchronization
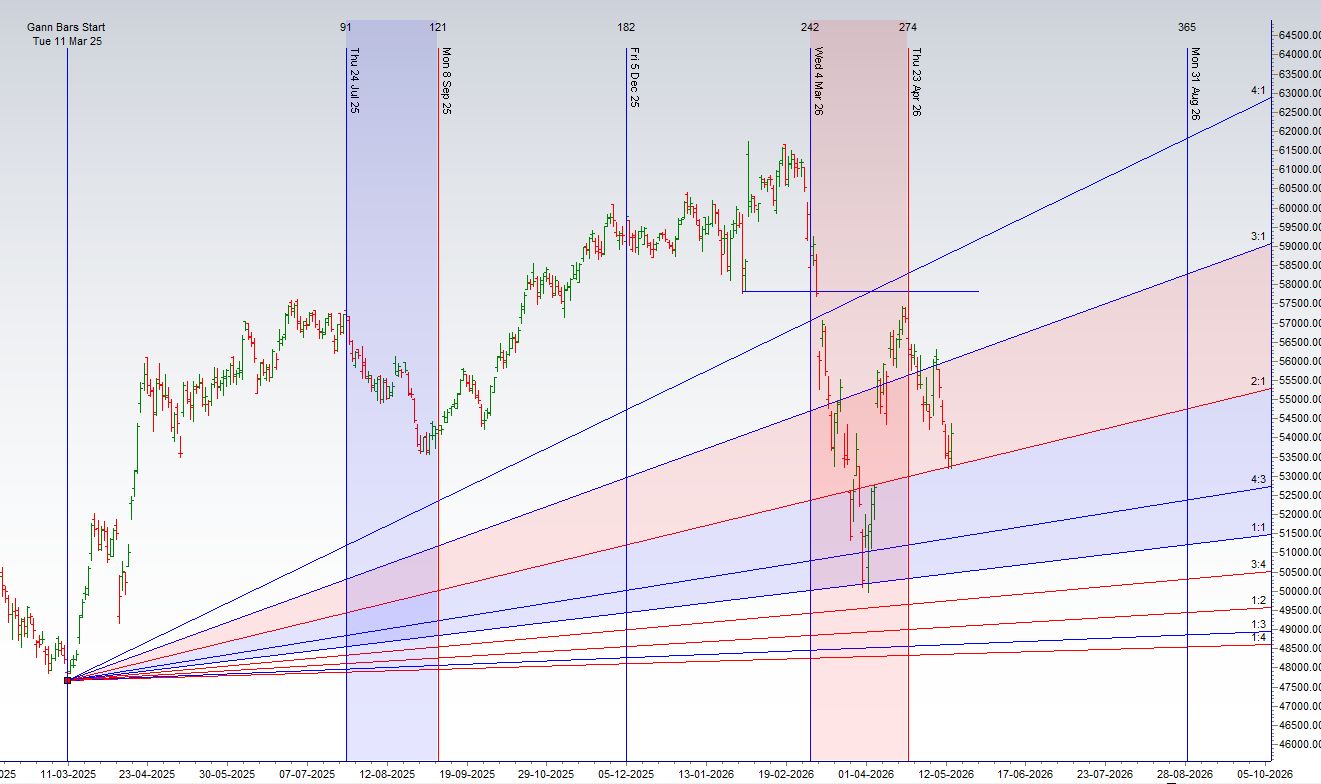
From a purely geometric perspective, the morning panic halted precisely at 52,767, marking a mathematically perfect bounce off the 2×1 Gann Angle. This level beautifully validated the energetic convergence of the current Mercury and Mars ingress cycles.
[Gann 2x1 Angle Support: 52,767] ───► [Current Spot: 53,533.80] ───► [Astro Breakout Trigger: 53,705]
The temporal landscape shifts immediately tomorrow with the highly anticipated Venus ingress. To unlock an aggressive short-covering engine capable of driving a structural move back toward 54,286 and 54,643, price must decisively clear and sustain above the astro-trigger line of 53,705.
High-Probability Intraday Reversal Windows
Traders must monitor their execution charts for potential price-time squaring pivots at the following exact intervals:
-
10:14
-
12:29
-
01:58
-
02:44
3. The Options Matrix & Volatility Boundaries
The derivatives sheet prints a Put-Call Ratio (PCR) of 0.79, indicating a heavily guarded overhead territory. Total Open Interest is heavily weighted toward the Call side (Calls at 167.61 Lakh vs. Puts at 132.93 Lakh), establishing clear operational boundaries for the expiry:
-
Key Resistance (Highest Call OI): 54,000 (The ultimate structural wall)
-
Key Support (Highest Put OI): 53,000 (The absolute institutional floor)
-
Max Pain Configuration: 55,100
This deep divergence between current spot prices and the Max Pain target implies that option writers are pricing in a capped downside, positioning themselves to pocket massive premium decay from retail option buyers caught in the middle of this range.
4. The Tactical Map: Structural Trading Levels
To navigate this high-turnover environment without falling into predictive bias, execution must be aligned with the institutional boundaries.
Macro Positional Target Axis
-
Trend Change Level: 54,942
-
Strategy: Maintaining core directional positions above or below this baseline aligns your capital directly with long-term institutional momentum, securing an optimal risk-reward ratio.
Intraday Trading Setup
-
Intraday Trend Filter: 53,333
-
The Strength Zone (Upside Execution): If the spot index sustains above 53,729, it flags the entry of aggressive buyers. Immediate targets to lock in profits stand at 53,875, 54,000, and 54,213.
-
The Weakness Zone (Downside Execution): Selling pressure will immediately intensify if the index breaks back below 53,433. In this scenario, protect longs and play the short scalps toward the support targets at 53,329, 53,225, and 53,050.
5. The Desk Philosophy
In a market defined by wild 966-point intraday sweeps, chasing price action in the dead center of the daily range is financial suicide. The big players intentionally leverage macro headlines to trigger retail panic, using that sudden liquidity to cover their old positions and seed fresh cycles. Respect the intraday anchor at 53,333, let the time-cycle windows confirm your turning points, and let the late-paying momentum traders get chewed up by the range before you deploy your risk capital. Stay disciplined.