


Disclaimer
This analysis represents the highest-probability forecast derived from expert, multi-decade historical evaluation of astrological signatures and their documented correlation with market psychology and price action.
No Guarantee
This is not a guarantee of future market performance. Financial markets are influenced by numerous dynamic and unpredictable real-world factors. All trading and investment activities carry significant risk, including the potential loss of principal.
Educational Purpose Only
This content is strictly for informational and educational purposes and should not be construed as financial advice or a recommendation to buy, sell, or trade any financial instrument.
Consult a Professional
We strongly advise you to consult a qualified financial advisor before making any investment decisions. Any actions you take based on this analysis are solely your responsibility. We assume no liability for any financial profits or losses that may occur.
Theme: The Breakdown Cascade and The Saturnine Test
Act I (Start of Week)
The Nifty 50 enters the week facing a structural breakdown environment. The massive 300-point gap-down on the open completely invalidates prior bullish structures, reacting directly to the global overnight liquidations. This price destruction occurs under the immediate influence of Bayer Rule 31, signaling a structural trend change via Venus declination. As the Last Quarter Moon unfolds on Monday, weak retail hands will panic, accelerating the initial slide.
IF the Nifty 50 fails to reclaim the opening 30-minute range high, THEN the index will target the major historical support cluster at 22,850. Bulls must defend this line in the sand to prevent systemic damage. IF the index breaks and closes below 22,850 on a daily basis, THEN it will trigger a deeper structural slide toward 22,600.
For a Detailed Day by Day Forecast with Neural Analysis Please watch the below video
Nifty Harmonic Pattern
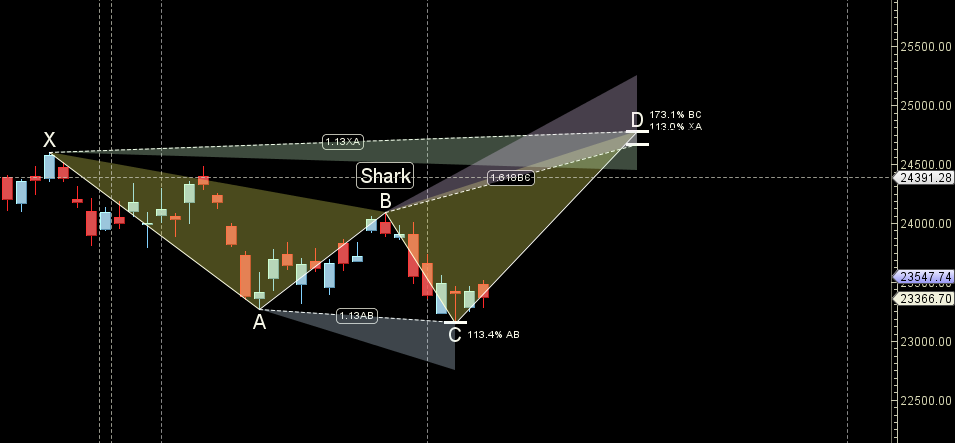
Price above 23050 can see rally towards 23333/23666
Nifty Gann Angles
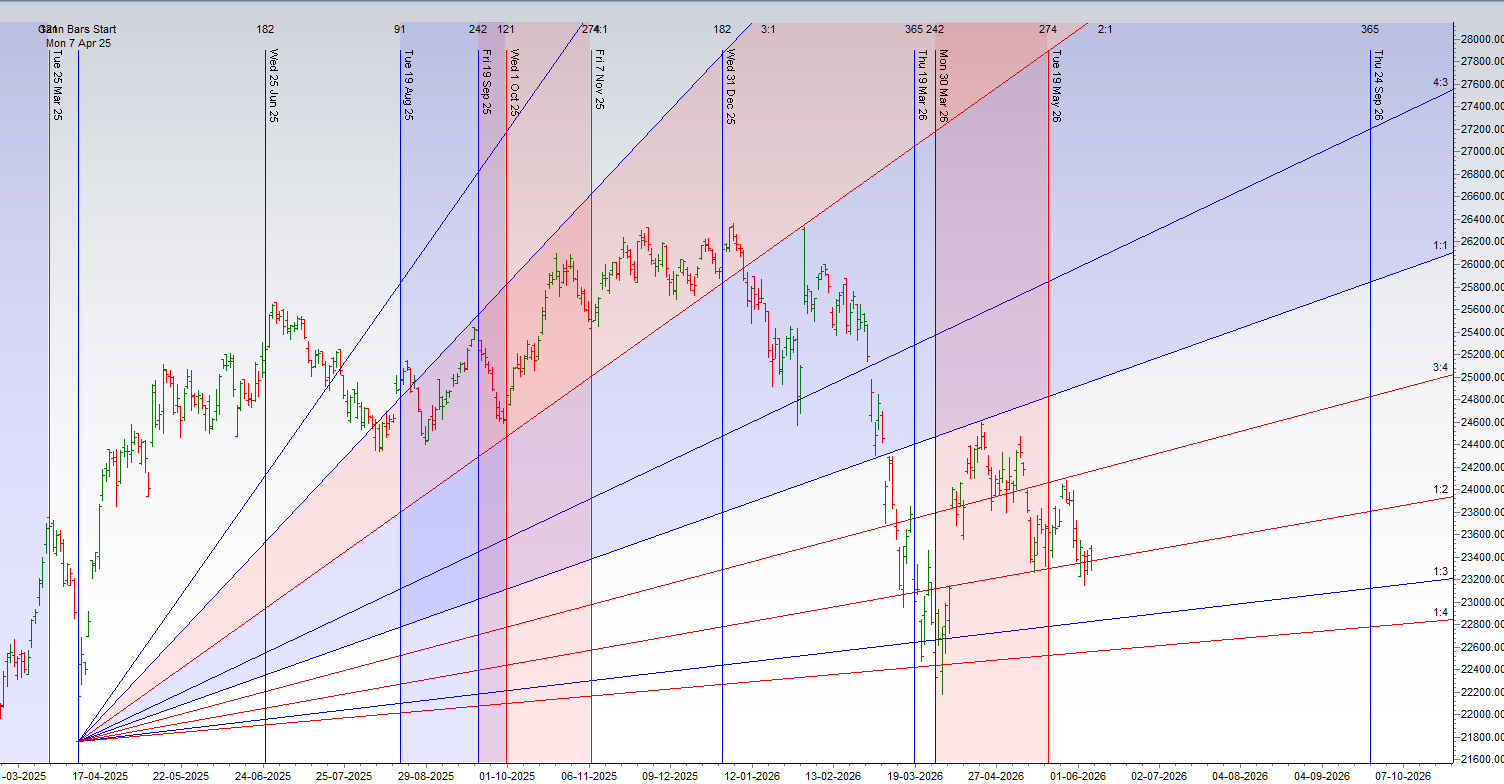
Price is heading towards its 1×3 gann angle Support zone.
Nifty Supply and Demand
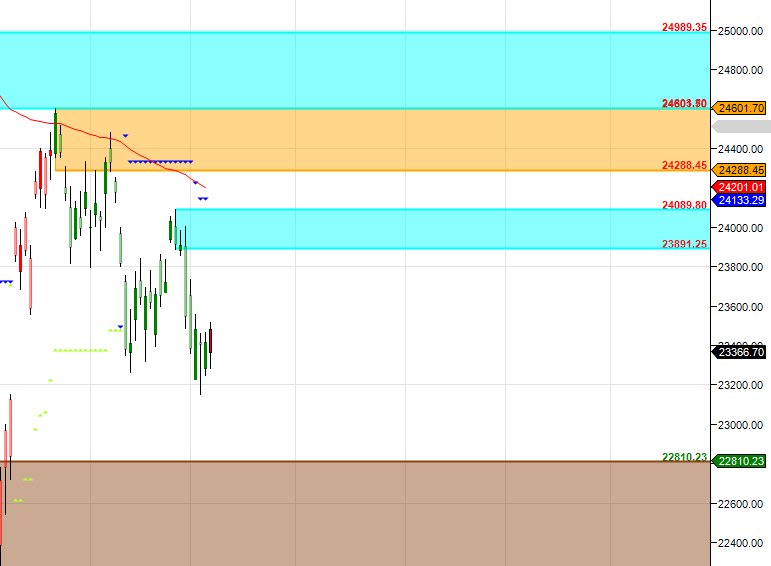
Self Explanatory Chart
Nifty Time Analysis Pressure Dates
Key Pivot Dates: Watch 10 June
Nifty Weekly Chart
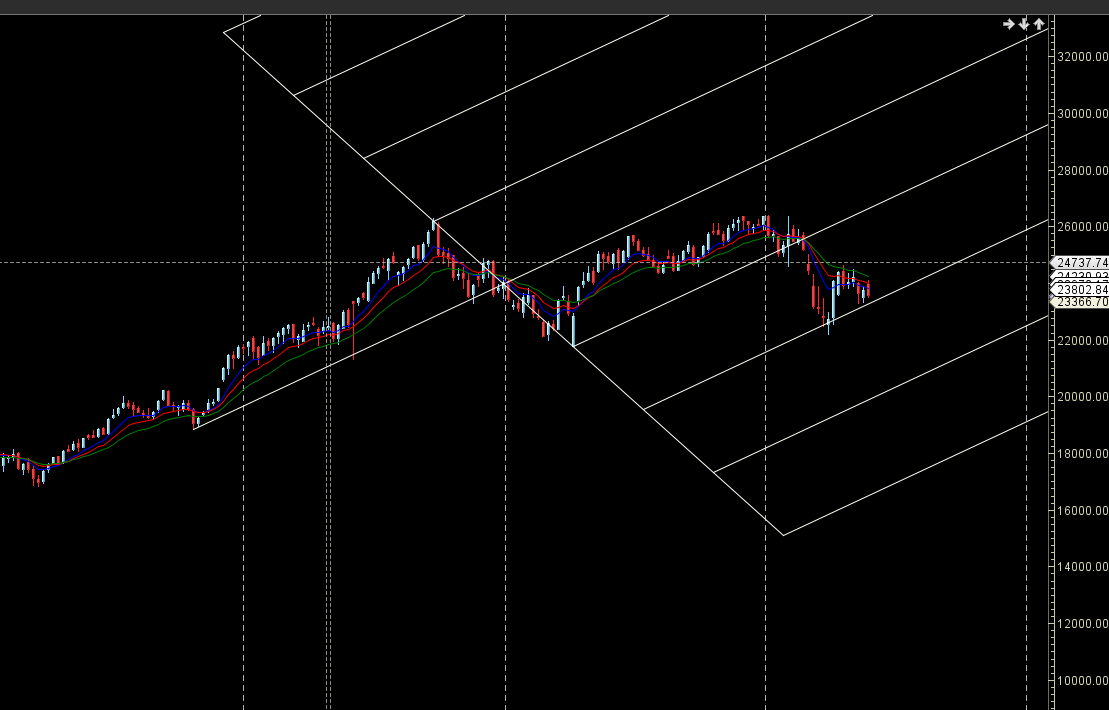
Nifty formed perfect support at AF zone
Nifty Monthly
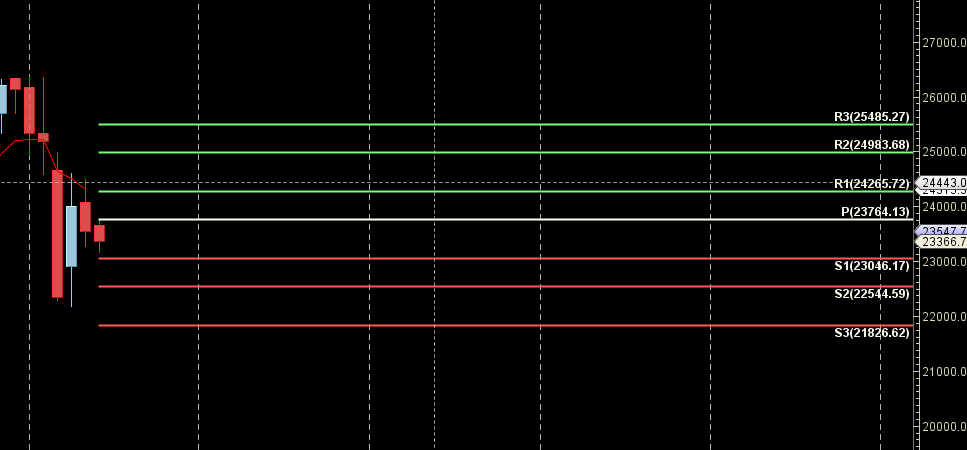
23764 is Monthly resistance zone 22544is Monthly Support zone.
Nifty Weekly Levels
Nifty Trend Deciding Level: 23056
Nifty Resistance: 23133 23209 23286 23363 23439
Nifty Support: 22979 22902 22848 22777 22666
Levels mentioned are Nifty Spot
As always I wish you maximum health and trading success
Learn More:
W.D. Gann Trading Strategies – Learn how to decode markets using price, time, and geometry.
Trading Using Financial Astrology – Discover how planetary motion impacts market behavior and how to trade it effectively.
Ready to Trade Like a Time-Master?
Join our one-on-one mentorship to master astro-timing, Gann analysis, and institutional-grade setups.
Call: 09985711341
Email: bhandaribrahmesh@gmail.com