


A Hollow Victory: The Anatomy of a Classic Short Squeeze
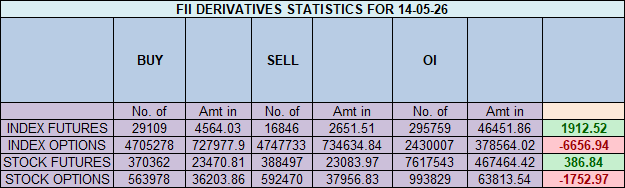
On May 14, 2026, the Nifty market delivered a powerful 237-point rally, giving the appearance of a major bullish reversal with strong institutional backing. The headline showed Foreign Institutional Investors (FIIs) as massive net buyers of 9,414 contracts. However, this surface-level strength is a profound deception.
The day’s most critical and revealing event was a colossal collapse in net Open Interest (OI) of 9,752 contracts. This is not the signature of a new, healthy bull run. This is the unmistakable footprint of a violent, late-stage short squeeze, built on a foundation of profound trend exhaustion and participant capitulation.
Decoding the Data: The Mechanics of a Hollow Rally
1. The FIIs’ “Deceptive” Buy: This is a Strategic Exit, Not a New Entry
The headline “buy” figure is a classic misdirection. The granular breakdown exposes the FIIs’ true, brilliant strategy. The definitive signal that this was not a new bullish initiative is that they covered (bought back) a colossal 10,060 short contracts.
The astrological reason for this action is that the market reached a point of climactic exhaustion where professional players saw the perfect opportunity to exit. The catalyst for their buying was the mass panic, which provided the ideal liquidity for a massive profit-taking operation. Simultaneously, they added only 2,203 new long contracts, likely as a tactical hedge. This was a massive profit-taking operation. They were not building a new bull case; they were cashing in their winning bearish tickets. Their overall positioning remains profoundly bearish at 11:89, proving they have not changed their core view; they have simply secured their profits.
2. The Main Event: The Great Client Capitulation
The most stunning number of the day came from the retail clients. They covered (sold) a staggering 10,610 long contracts, a classic sign of capitulation where long-time holders can no longer stand the pain and are forced to sell, often right at the market’s turning point. This massive selling provided the bids the FIIs needed to cover their shorts.
This dual-sided capitulation is why the OI collapsed so violently. The market is “hollowing out.”
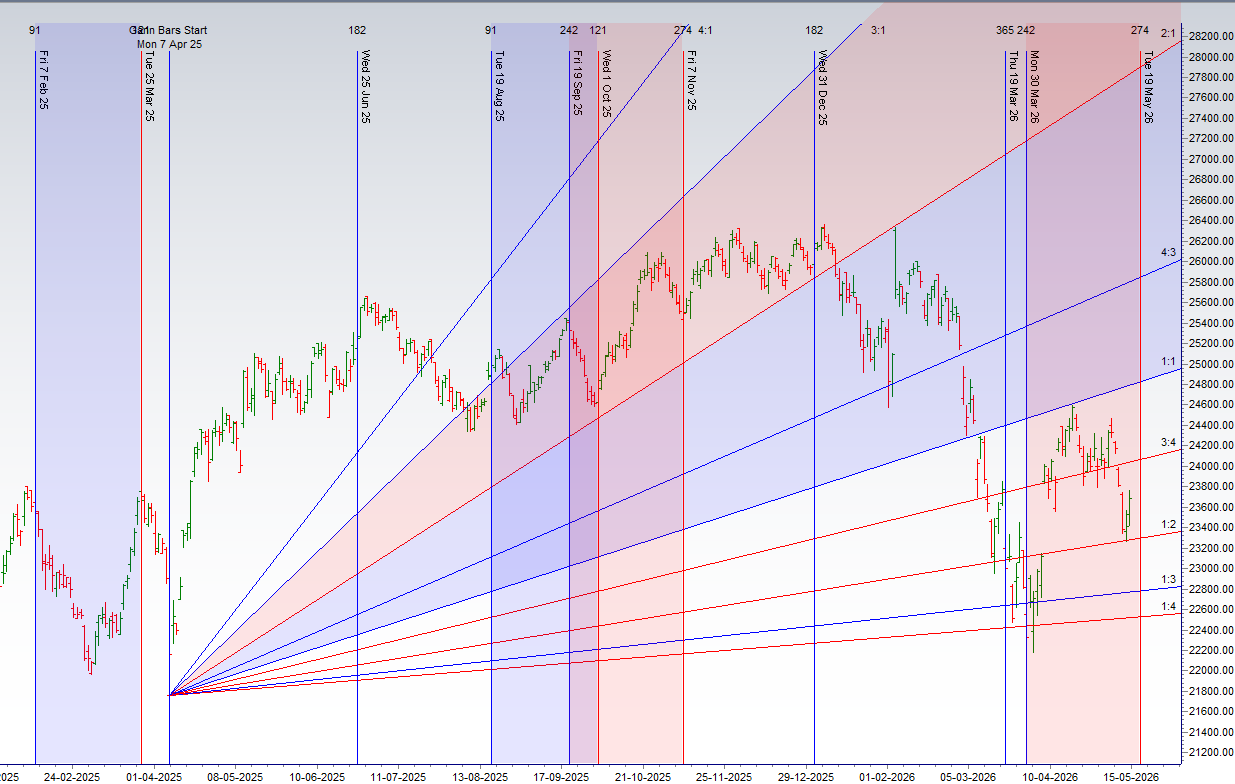
The Nifty has delivered a stunning and powerful validation of our astro-technical model, executing a perfect bounce back from the recent lows. This powerful reversal saw the bulls successfully protect the crucial Gann octave point of 23,400 and culminated in the formation of a new higher high, a classic and high-conviction signal that a major turning point has been reached and a new bull trend is beginning.
This is not a random bounce. This technical reversal was powerfully timed by two independent, high-conviction catalysts:
-
The Price Catalyst: The low was made with precision at a key Gann angle support, providing the geometric foundation for the reversal.
-
The Time Catalyst: The turn was triggered by Bayer Rule 7, a significant astrological event that forecasts market changes when Venus or Mars reaches a key point in its orbit.
The astrological reason for this reversal is that the catalyst, Bayer Rule 7, marked a point of cyclical exhaustion for the bearish trend, forcing a definitive shift in market energy.
The Bullish Mandate: Defending the New Territory
The bears have been defeated, and a new bull trend has been born. The technical landscape has now been fundamentally redrawn, and the bulls are in a commanding position.
The Bullish Fortress:
This is the new, non-negotiable line of support defined by the Gann octave and angle.
-
The Condition: As long as the price remains above the 23,400 pivot zone, the bulls have absolute and unquestioned control over the market’s trend. This level is the foundational support that must be defended to maintain the new bullish momentum.
-
The Outcome: A successful hold above this fortress confirms that the bulls are in charge, and the rally is poised to continue.
The Strategic Objective: The Battle for the Weekly Close
With tomorrow being the crucial weekly close, the bulls have a clear and ambitious objective. They are not just looking for a positive close; they are looking to “paint the weekly chart” with a signal of undeniable strength, setting a powerful bullish tone for the weeks ahead.
-
The Bullish Target: A weekly close within the range of 23,900 – 23,950. A close in this zone would be a major technical victory, confirming not just a reversal, but a powerful one with significant momentum, and would position the market for an assault on the 24,000 psychological level.
Conclusion
The battle for the bottom is over, and the bulls have won a decisive, cyclically-timed victory. A new bull trend has begun. The path of least resistance is now definitively upwards. As long as the bulls defend their new fortress at 23,400, a powerful test of the 23,900-23,950 zone into the weekly close is now the high-probability scenario. The market has transitioned from a defensive posture to a powerful, offensive one.
Nifty April Futures Open Interest Volume stood at 1.76 lakh cr , witnessing liquidation of 8 Lakh contracts. Additionally, the increase in Cost of Carry implies that there was closeuer of SHORT positions today.
Nifty Advance Decline Ratio at 47:03 and Nifty Rollover Cost is @22556 closed above it.
In the cash segment, Foreign Institutional Investors (FII) bought 187.46 cr while Domestic Institutional Investors (DII) bought 684.33 cr
The Nifty options market is radiating a strong and confident bullish sentiment, signaling that bulls have seized control and a firm support base is in place. A powerfully positive Put-Call Ratio (PCR) of 1.22 confirms this shift, indicating that total put open interest has decisively surpassed call open interest. This is a classic sign of a market that has shed its fear, driven by aggressive put writers who are confidently selling downside protection and thereby building a formidable support structure beneath the index.
This bullish confidence has anchored the market right at its financial center of gravity, the Max Pain point of 23,700. With the current price trading almost exactly at this level (23,713), the market is in a position of strength, holding its ground at the point of maximum financial pain for option buyers. This confirms that this level has now become a solid foundation and a new structural pivot.
This bullish setup has forged a clear and well-defended battlefield for the week:
-
Resistance: The primary resistance and a massive “Great Wall of Calls” is located at the 24,000 psychological strike. The 23,800 level acts as an immediate hurdle.
-
Support: A powerful support floor, reinforced by aggressive put writing, has been built at 23,500, which holds the highest concentration of Put OI. The 23,700 Max Pain level itself will also act as a crucial pivot.
In conclusion, the Nifty is in a strong, well-supported “buy on dips” environment. The path of least resistance is upwards, with the bulls now set to challenge the next resistance zones, firmly backed by the powerful support floor they have built at 23,500. The market is consolidating its gains at a high-level pivot before its next major up-move.
Nifty Spot – Intraday Chart Observation
Technical Setup: The index is approaching critical breakout levels. Watch these zones for price action confirmation:
-
Strength (Upside): Momentum is expected to pick up if Nifty sustains above 23729 . In this scenario, the immediate resistance levels are 23777 23816 and 23864
-
Weakness (Downside): The trend technically weakens if the index slips below 23660 This could open the path towards support levels at 23630, 23585 and 23512.
Wishing you good health and trading success as always.As always, prioritize your health and trade with caution.
As always, it’s essential to closely monitor market movements and make informed decisions based on a well-thought-out trading plan and risk management strategy. Market conditions can change rapidly, and it’s crucial to be adaptable and cautious in your approach.
► Join Youtube channel : Click here
► Check out Gann Course Details: W.D. Gann Trading Strategies
► Check out Financial Astrology Course Details: Trading Using Financial Astrology
► Check out Gann Astro Indicators Details: Gann Astro Indicators