


Technical analysis of Angel One, Indian Bank and Ashok Leyland reveals interesting Harmonic Pattern formations, with clearly defined upside targets, Potential Reversal Zones (PRZ) and stop-loss levels.
The charts highlight bullish trading opportunities based on Harmonic Pattern structures, Fibonacci projections and price-action confirmation. Traders can use these predefined levels to plan their entries, manage risk and identify potential profit-booking zones.
In this analysis, we examine the important support and resistance levels, upside targets and invalidation points for all three stocks.
1. Angel One – Bullish Harmonic Setup
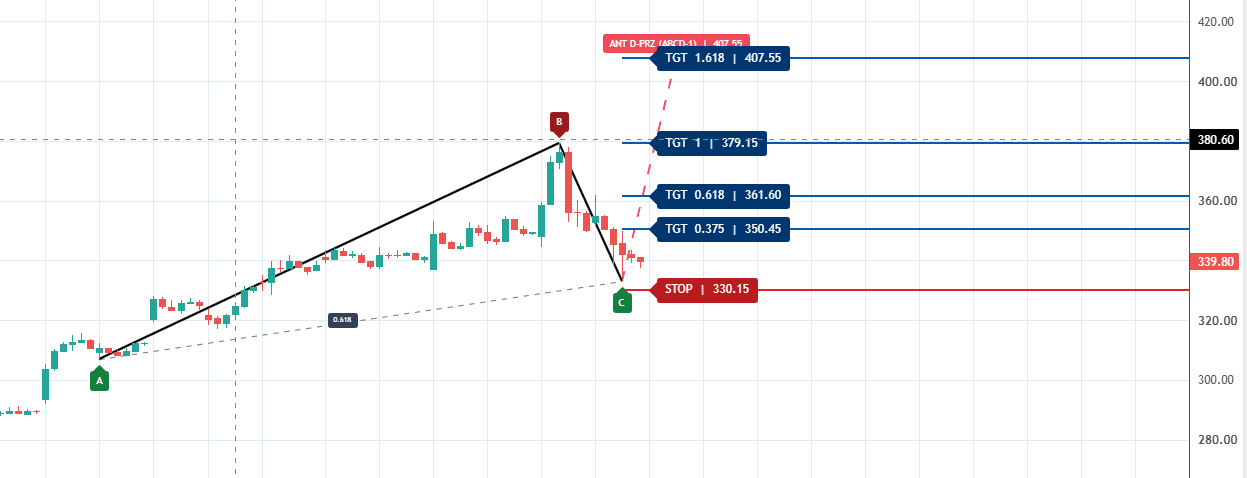
Angel One is showing a potential bullish reversal structure after completing its corrective decline towards the C-point region.
The chart identifies a bullish Harmonic Pattern setup, with the projected upside levels calculated using Fibonacci extensions.
Important trading levels
| Parameter | Price |
|---|---|
| Current Market Price | 339.80 |
| First Target (0.375) | 350.45 |
| Second Target (0.618) | 361.60 |
| Third Target (1.000) | 379.15 |
| Extended Target (1.618) | 407.55 |
| Stop Loss | 330.15 |
| Potential Reversal Zone (D) | 407.55 |
Trading Strategy
-
Above 350.45, the stock could gain positive momentum.
-
Sustaining above 361.60 may open the possibility of an extended move towards 379.15.
-
A move towards 407.55 represents the higher Fibonacci projection.
-
A decisive break below 330.15 would invalidate the current bullish trading setup.
Technical View: Angel One offers an interesting risk-defined bullish opportunity. Traders should monitor the 350.45 level as the first important upside hurdle.
2. Indian Bank – Bullish Recovery Setup
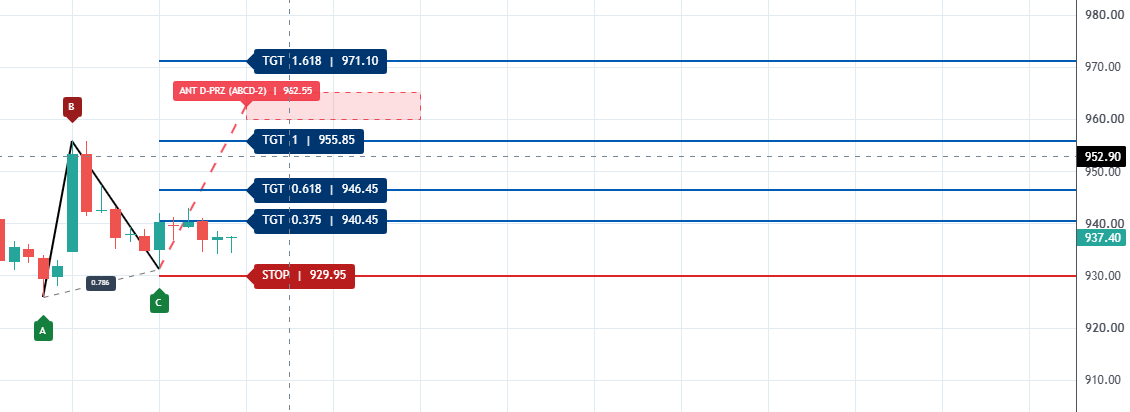
Indian Bank is showing signs of recovery after a correction from its recent swing high. The chart identifies a bullish ABCD-based Harmonic structure, with the C-point forming near the 930 region.
The stock is currently trading around 937.40, with multiple Fibonacci-based upside objectives.
Important trading levels
| Parameter | Price |
|---|---|
| Current Market Price | 937.40 |
| First Target (0.375) | 940.45 |
| Second Target (0.618) | 946.45 |
| Third Target (1.000) | 955.85 |
| Extended Target (1.618) | 971.10 |
| Stop Loss | 929.95 |
| Potential Reversal Zone (D) | 962.55 |
Trading Strategy
-
The immediate hurdle is 940.45.
-
A sustained move above 940.45 could extend towards 946.45.
-
Above 946.45, the next important objective is 955.85.
-
A stronger bullish move could extend towards 971.10.
-
Below 929.95, the current bullish setup would be invalidated.
Technical View: Indian Bank needs to sustain above the 940.45–946.45 zone to establish stronger bullish momentum. The 955.85 level is the next significant upside objective.
3. Ashok Leyland – Bullish Harmonic Reversal Pattern
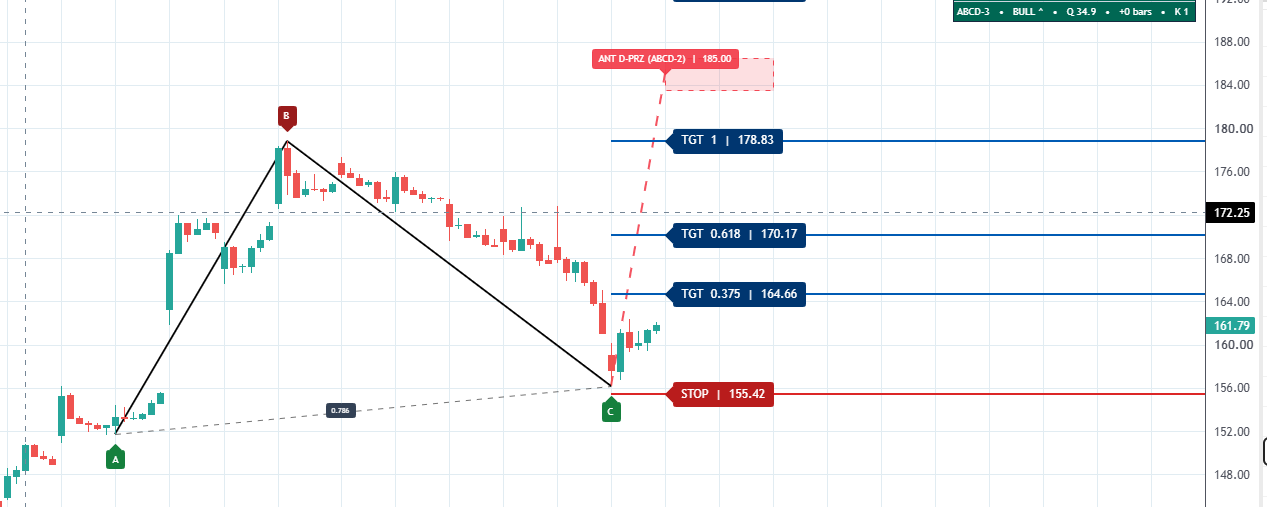
Ashok Leyland is displaying a potential bullish Harmonic reversal formation following a significant correction from its recent swing high.
The stock has recovered from the C-point region near 155.42, and the chart indicates a possible bullish continuation towards the Fibonacci projection levels.
The projected Potential Reversal Zone is around 185.
Important trading levels
| Parameter | Price |
|---|---|
| Current Market Price | 161.79 |
| First Target (0.375) | 164.66 |
| Second Target (0.618) | 170.17 |
| Third Target (1.000) | 178.83 |
| Potential Reversal Zone (D) | 185.00 |
| Stop Loss | 155.42 |
Trading Strategy
-
164.66 is the immediate upside target.
-
Sustaining above 164.66 could strengthen the recovery.
-
A move above 170.17 may open the possibility of 178.83.
-
The larger harmonic projection zone is around 185.
-
A break below 155.42 would invalidate the bullish setup.
Technical View: Ashok Leyland is showing an interesting reversal opportunity. The 164.66 and 170.17 levels are important hurdles to watch before expecting a larger move towards 178.83–185.