


KEI Industries
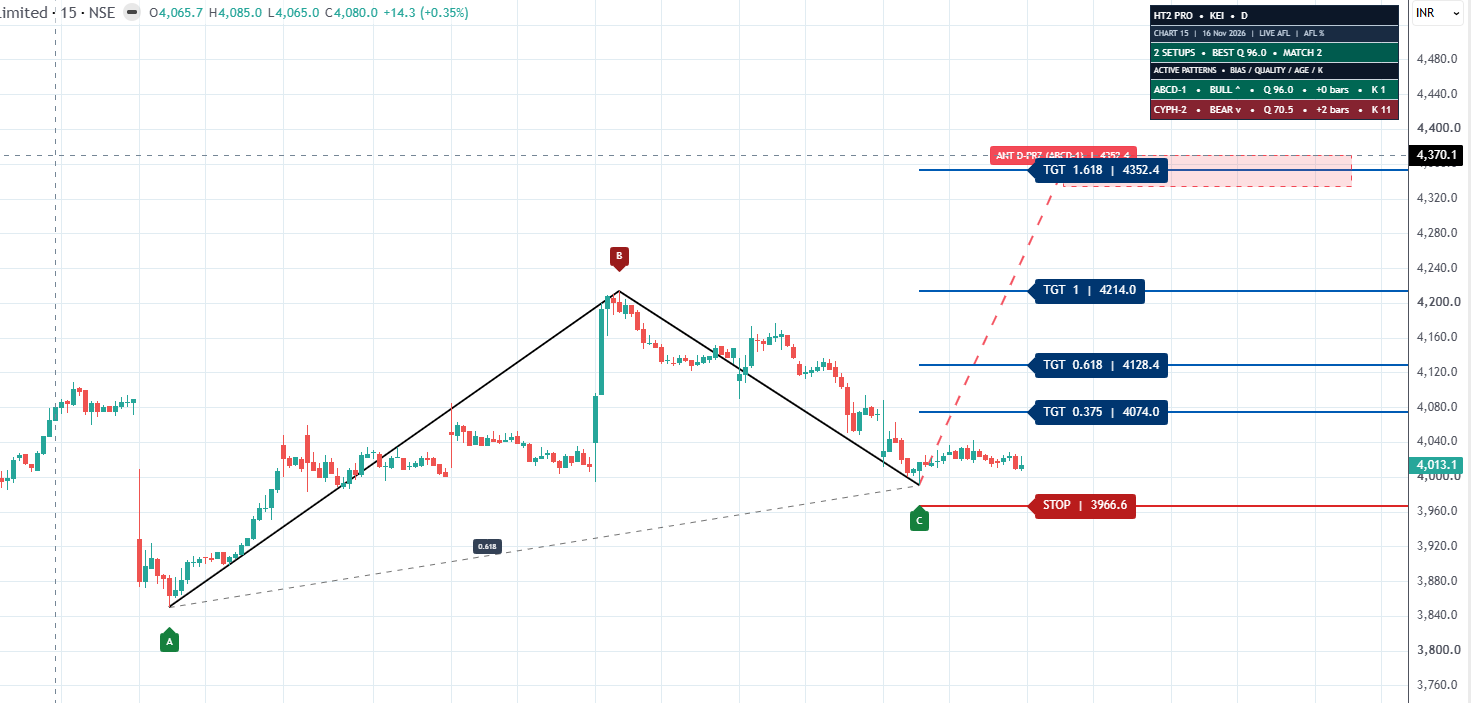
Chart structure: Bullish ABCD pattern
Key technical levels
| Level | Price |
|---|---|
| Immediate support | 4,013 |
| Critical support / pattern stop | 3,966.6 |
| First resistance | 4,074 |
| Second resistance | 4,128.4 |
| Major resistance | 4,214 |
| Positional target 1 | 4,352.4 |
| Extended pattern zone | 4,370.1 |
Intraday outlook
-
CMP: 4,013.1
-
Intraday trigger: 4,017.1
-
Target 1: 4,074
-
Target 2: 4,128.4
-
Target 3: 4,214
-
Extended Target: 4,352.4
-
Stop / Pattern Invalidation: 3,966.6
Intraday outlook: Above 4,017.1, upside targets are 4,074 → 4,128.4 → 4,214 → 4,352.4.
Positional outlook
The broader projected structure remains positive as long as 3,966.6 holds. A sustained move above 4,214 would strengthen the possibility of an extension towards 4,352–4,370.
Glenmark Pharmaceuticals
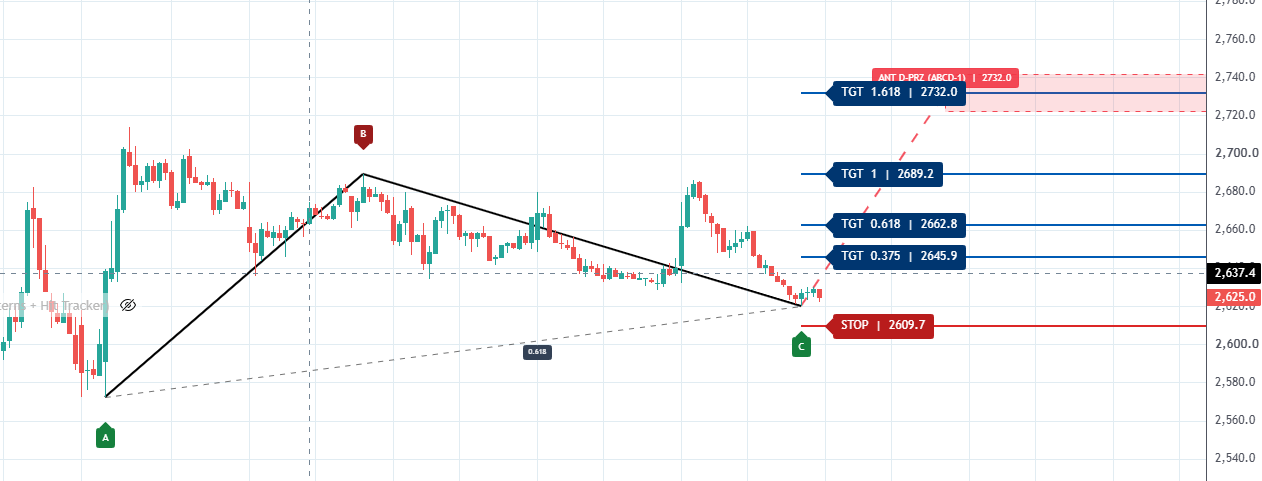
Chart structure: Bullish ABCD projection
Glenmark is showing a potential recovery from the C-point near 2,610. The chart has generated multiple Fibonacci-based upside targets.
Key technical levels
| Level | Price |
|---|---|
| Current chart price | 2,625 |
| Critical support / pattern stop | 2,609.7 |
| First resistance | 2,645.9 |
| Second resistance | 2,662.8 |
| Third resistance | 2,689.2 |
| Positional target | 2,732 |
Intraday outlook
-
CMP: 2,625
-
Intraday trigger: 2,627.6 (+0.1%)
-
Target 1: 2,645.9
-
Target 2: 2,662.8
-
Target 3: 2,689.2
-
Extended Target: 2,732
-
Stop / Pattern Invalidation: 2,609.7
Intraday outlook: Above 2,627.6, upside targets are 2,645.9 → 2,662.8 → 2,689.2 → 2,732.
Positional outlook
The structure favours a recovery towards 2,689, followed by 2,732, provided the 2,609.7 support remains intact.
A sustained move above 2,689 would be an important development for the positional structure.
Adani Power
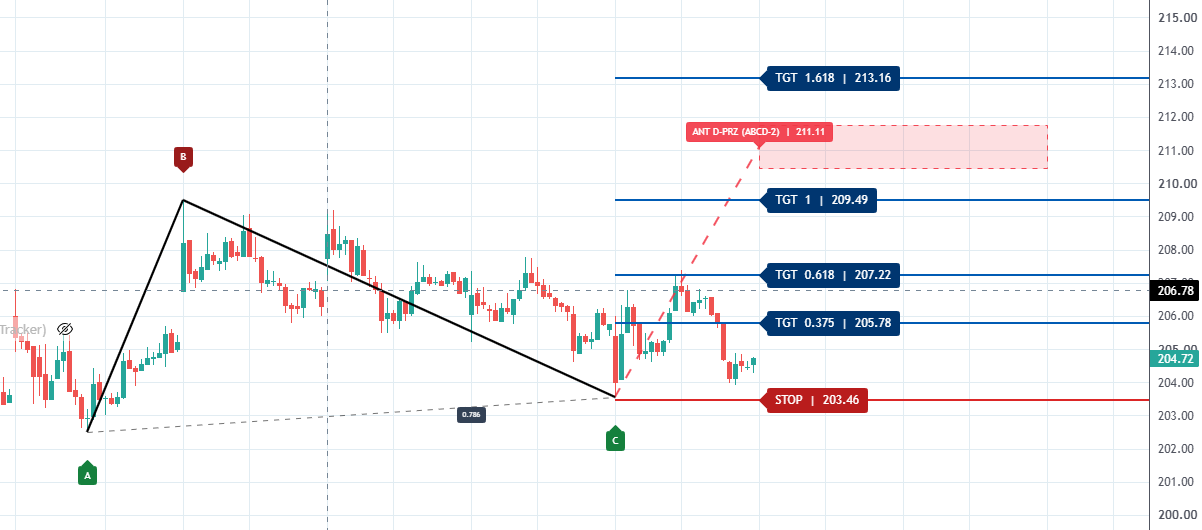
Chart structure: Bullish ABCD projection
Adani Power has formed a potential reversal structure near 203.46. The stock is attempting to recover from the C-point, but the immediate resistance zone needs to be crossed for momentum confirmation.
Key technical levels
| Level | Price |
|---|---|
| Current chart price | 204.72 |
| Critical support / pattern stop | 203.46 |
| First resistance | 205.78 |
| Second resistance | 207.22 |
| Third resistance | 209.49 |
| Positional target 1 | 213.16 |
| Pattern completion zone | 211.11 |
Intraday outlook
-
CMP: 204.72
-
Intraday trigger: 204.92
-
Target 1: 205.78
-
Target 2: 207.22
-
Target 3: 209.49
-
Extended Target: 213.16
-
Stop / Pattern Invalidation: 203.46
Intraday outlook: Above 204.92, upside targets are 205.78 → 207.22 → 209.49 → 213.16.
Positional outlook
The structure remains constructive above 203.46. A sustained move above 209.49 could open the way towards the 211–213 zone.
Disclaimer:
Bramesh Tech Analysis is not a SEBI-registered investment advisor or research analyst. The information, charts, technical analysis, market views, price levels, and forecasts shared are strictly for educational and informational purposes only.
All analysis is based on technical indicators, chart patterns, Gann techniques, and other analytical methodologies. Nothing shared should be construed as investment advice, a recommendation, or a solicitation to buy, sell, or hold any security or financial instrument.
We do not provide guaranteed returns or assure the accuracy of any forecast. Financial markets involve substantial risk, and past performance does not guarantee future results.
Readers and subscribers are advised to conduct their own independent research and consult a SEBI-registered investment advisor before making any investment or trading decisions.
All trading and investment decisions are solely at the individual’s own risk and responsibility.