


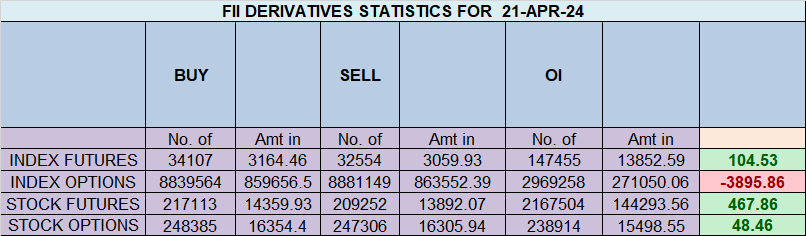
Foreign Institutional Investors (FIIs) displayed a Neutral approach in the Index Futures market by buying 1553 contracts worth 104 crores, resulting in a increase of 7573 contracts in the Net Open Interest. FIIs bought 4949 long contracts and Sold 2624 short contracts, indicating a preference for initiating new Long positions. With a Net FII Long Short ratio of 0.614, FIIs utilized the market fall to enter long positions and enter short positions in Index Futures.
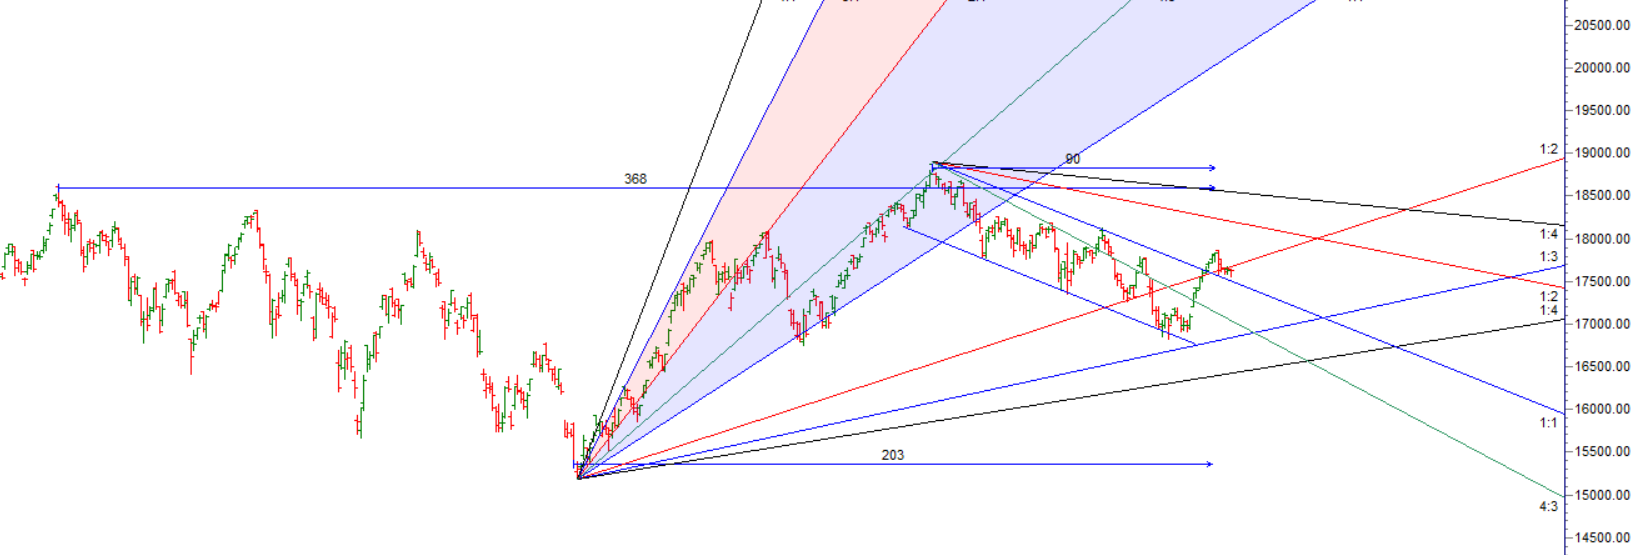
As Discussed in Last Analysis Nifty continue to holds its 1×3 gann angle and another day Held on to its 200 DMA Today High and Low are important as its Solar Eclipse today.
Mercury Retrograde happened on 21 April and it generally leads to trend change, Monday we will react to Reliance Industries Levels are shared below.
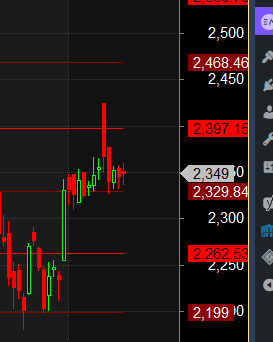
Reliance Industries after results
Bullish above 2397 only for a move towards 2468
Bearish below 2329 for a move towards 2262
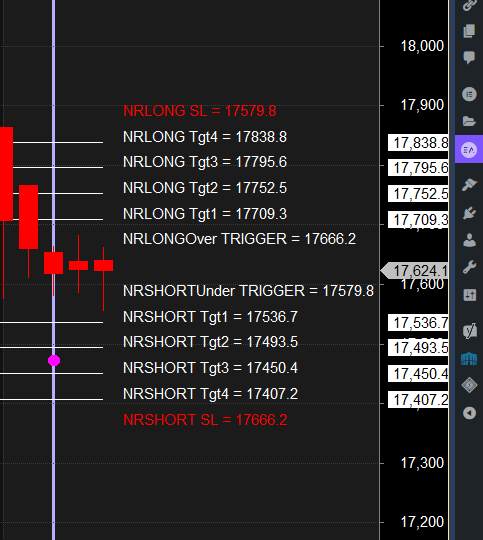
For Swing Traders Break of 17576 can see a fall towards 17532/17453/17375/17297. Bulls will get active above 17700 for a move towards 17752/17795/17838.
Traders may watch out for potential intraday reversals at 9:15,9:55,10:55,12:01,1:31 How to Find and Trade Intraday Reversal Times
Price is taking multiple support at 200 DMA Another day 200 SMA was held.

Nifty April Futures Open Interest Volume stood at 0.91 lakh, witnessing a liquidation of 1.5 lakh contracts. Additionally, the decrease in Cost of Carry implies that there was a closure of short positions today.
Nifty options chain shows that the maximum pain point is at 17650 and the put-call ratio (PCR) is at 1.02. Typically, when the PCR open interest ranges between 0.90 and 1.05, the market tends to remain range-bound. This suggests that Nifty may trade within a range of 17600-17800 levels in the near term.
According To Yesterday Data, Retailers Have Bought 1386289 Call Option Contracts And 1256381 Call Option Contracts Were Shorted by them. Additionally, They Bought 779874 Put Option Contracts And Added 814031 Shorted Put Option Contracts, Indicating A BULLISH Outlook.
In Contrast, Foreign Institutional Investors (FIIs) Bought 214096 Call Option Contracts And 270660 Call Option Contracts Were Shorted by them. On The Put Side, FIIs Bought 149967 Put Option Contracts And Shorted 135989 Put Option Contracts, Suggesting They Have Turned To A BEARISH Bias.
Nifty 50 Options Chain Analysis
The Nifty 50 options chain indicates that the highest open interest (OI) on the call side is at the 17,700 strike, followed by 17,800 strikes. On the put side, the highest OI is at the 17600 strike, followed by 17500 strikes. This suggests that the market participants are expecting Nifty 50 to remain range between 17500-17700 levels.
In the cash segment, Foreign Institutional Investors (FII) sold 2116 crores, while Domestic Institutional Investors (DII) bought 1632 crores.
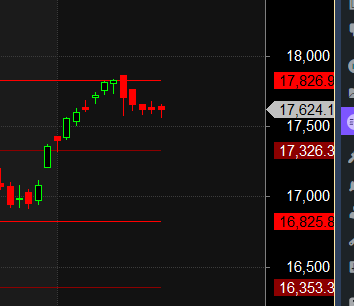
Traders who follow the musical octave trading path may find valuable insights in predicting Nifty’s movements. According to this path, Nifty may follow a path of 16825-17326-17826. This means that traders can take a position and potentially ride the move as Nifty moves through these levels.Of course, it’s important to keep in mind that trading is inherently risky and market movements can be unpredictable.
The successful speculator bases NO moves on what supposedly will happen, but reacts instead to what does happen.
For Positional Traders, The Nifty Futures’ Trend Change Level is At 17622 . Going Long Or Short Above Or Below This Level Can Help Them Stay On The Same Side As Institutions, With A Higher Risk-reward Ratio. Intraday Traders Can Keep An Eye On 17643, Which Acts As An Intraday Trend Change Level.