


Foreign Institutional Investors (FIIs) displayed a Neutral approach in the Index Futures market by buying 4896 contracts worth 475 crores, resulting in a increase of 1294 contracts in the Net Open Interest. FIIs bought 3095 long contracts and Sold 1801 short contracts, indicating a preference for initiating new Long positions. With a Net FII Long Short ratio of 0.61 , FIIs utilized the market fall to enter long positions and exit short positions in Index Futures.
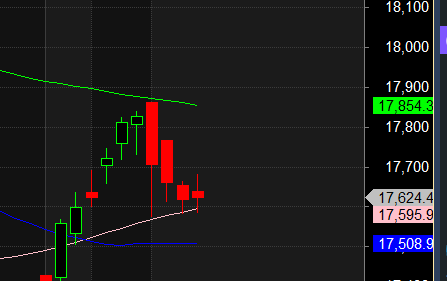
As Discussed in Last Analysis A hybrid solar eclipse occurs when the moon passes directly between the earth and the sun, but the size of the moon is not large enough to completely block out the sun. As a result, some parts of the earth will experience a total solar eclipse, while others will see an annular solar eclipse. Solar eclipses have been known to have a significant impact on the stock market. Studies have shown that the stock market tends to be volatile during the weeks leading up to and following a solar eclipse. In the past, some major stock market crashes have occurred within a year of a solar eclipse. Price is back to 1×2 angle suport and holding 17600. Last Hybrid SOlar Eclpise happened on 03 Nov 2013, Nifty topped out on 05 Nov and saw a decline.
Bank Nifty continue to holds its 1×3 gann angle and another day Held on to its 200 DMA Today High and Low are important as its Solar Eclipse today.

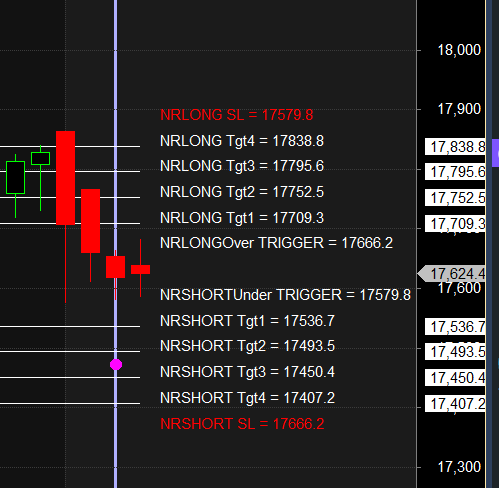
The Narrow Range 7 (NR7) trade setup is a popular strategy used by traders to identify potential breakouts in the market. The NR7 pattern occurs when the range of the current trading day is smaller than the previous six trading days. This suggests that there is a decrease in volatility and that the market may be preparing for a significant move.
To execute an NR7 trade setup, traders will typically wait for a breakout above or below the narrow range of the seventh day. If the breakout is to the upside, traders will go long and if the breakout is to the downside, they will go short. Traders will often use stop-loss orders to minimize risk and exit the trade if the market moves against them.
For Swing Traders Break of 17576 can see a fall towards 17532/17453/17375/17297. Bulls will get active above 17700 for a move towards 17752/17795/17838.
Traders may watch out for potential intraday reversals at 9:15,9:55,11:00,12:10,1:31 How to Find and Trade Intraday Reversal Times
Price is taking multiple support at 200 DMA
Nifty April Futures Open Interest Volume stood at 0.92 lakh, witnessing a addition of 0.07 lakh contracts. Additionally, the decrease in Cost of Carry implies that there was a closure of short positions today.
Nifty options chain shows that the maximum pain point is at 17700 and the put-call ratio (PCR) is at 0.98. Typically, when the PCR open interest ranges between 0.90 and 1.05, the market tends to remain range-bound. This suggests that Nifty may trade within a range of 17600-17800 levels in the near term.
Nifty 50 Options Chain Analysis
The Nifty 50 options chain indicates that the highest open interest (OI) on the call side is at the 17,700 strike, followed by 17,800 strikes. On the put side, the highest OI is at the 17600 strike, followed by 17500 strikes. This suggests that the market participants are expecting Nifty 50 to remain range between 17500-17700 levels.
In the cash segment, Foreign Institutional Investors (FII) sold 1169 crores, while Domestic Institutional Investors (DII) bought 832 crores.
Traders who follow the musical octave trading path may find valuable insights in predicting Nifty’s movements. According to this path, Nifty may follow a path of 16825-17326-17826. This means that traders can take a position and potentially ride the move as Nifty moves through these levels.Of course, it’s important to keep in mind that trading is inherently risky and market movements can be unpredictable.

Trading discipline” comes from modifying one’s behaviour in a desired direction and overcoming the mental resistance and fear that generally get in the way.
For Positional Traders, The Nifty Futures’ Trend Change Level is At 17620 . Going Long Or Short Above Or Below This Level Can Help Them Stay On The Same Side As Institutions, With A Higher Risk-reward Ratio. Intraday Traders Can Keep An Eye On 17655 , Which Acts As An Intraday Trend Change Level.