


ACC

Positional Traders can use the below mentioned levels
Close above 1425 Target 1465/1491
Intraday Traders can use the below mentioned levels
Buy above 1425 Tgt 1440, 1467 and 1485 SL 1415
Sell below 1411 Tgt 1397, 1376 and 1355 SL 1421
MCX
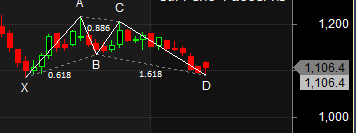
Positional Traders can use the below mentioned levels
Close above 1111 Target 1161
Intraday Traders can use the below mentioned levels
Buy above 1106 Tgt 1120, 1138 and 1156 SL 1096
Sell below 1089 Tgt 1077, 1060 and 1050 SL 1100
UBL
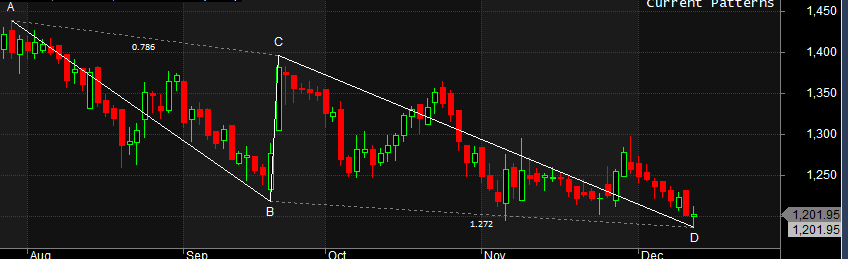
Positional Traders can use the below mentioned levels
Close above 1212 Target 1260/1296
Intraday Traders can use the below mentioned levels
Buy above 1206 Tgt 1215, 1225 and 1241 SL 1196
Sell below 1186 Tgt 1174, 1162 and 1150 SL 1196
How to trade Intraday and Positional Stocks Analysis — Click on this link
Performance sheet for Intraday and Positional is discussed for Nov Month, Intraday Profit of 3.62 Lakh and Positional Profit of 4.43 Lakh. Please note we do not have any “ADVISORY Service”, I share this sheet to see how the system are performing and money can be made in Stock Market if Trading Systems are followed with discipline. Performance “Will differ” from trader to trader.
http://tradingsystemperformance.blogspot.in/
http://stockpositionaltrading.blogspot.in/
- All prices relate to the NSE Spot/Cash Market
- Calls are based on the previous trading day’s price activity.
- Intraday call is valid for the next trading session only unless otherwise mentioned.
- Stop-loss levels are given so that there is a level below/above, which the market will tell us that the call has gone wrong. Stop-loss is an essential risk control mechanism; it should always be there.
- Book, at least, part profits when the prices reach their targets; if you continue to hold on to positions then use trailing stops to lock in your profits.
Thanks