


PNB
 PNB is near an important spiral number of 597, Closing below this today will lead stock to 576 and 555 in short term. Closing above the same 610 and 623 are intital target.
Buy above 598 Tgt 604,610 and 618 SL 595
Sell below 594 Tgt 589,582 and 576 SL 597
NMDC
 Positional traders can keep an eye on close above 147 for short term target of 152 and 157.
Buy above 145.5 Tgt 146.9,148.3 and 149.5 144
Sell below143.5 Tgt 142.2,140.8 and 139 SL 145
Asian Paint
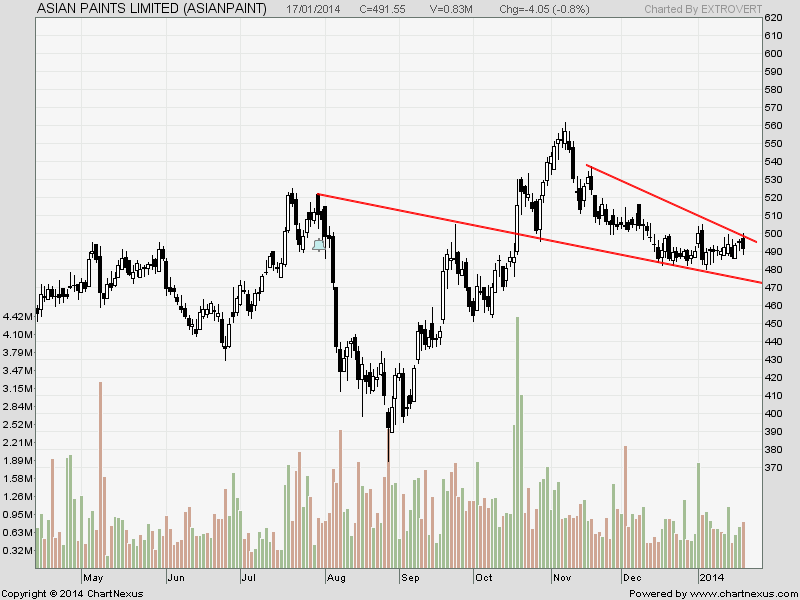
Buy above 493.5 Tgt 498,505 and 511 SL 491.5
Sell below 488 Tgt 486.4,481.3 and 475 SL 491.5
- All prices relate to the NSE Spot
- Calls are based on the previous trading day’s price activity.
- The call is valid for the next trading session only unless otherwise mentioned.
- Stop-loss levels are given so that there is a level below/above, which the market will tell us that the call has gone wrong. Stop-loss is an essential risk control mechanism; it should always be there.
- Book, at least, part profits when the prices reach their targets; if you continue to hold on to positions then use trailing stops to lock in your profits.