
Last Week Chopad Level of 6183 got triggered on Monday and achieved all target on upside.
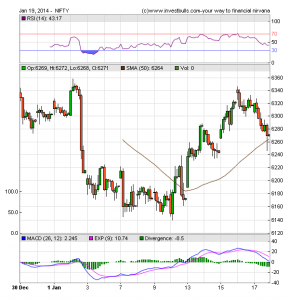
Nifty Hourly Chart
Nifty Hourly charts took support at 50 HSMA and bounced back, Holding range of 6241 nifty can bounce back to 6337 odd levels.
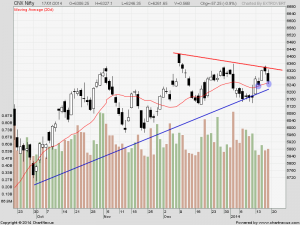
Nifty Daily Chart
Nifty again took support at 20 DMA as shown in above chart and took resistance at falling trendline so sideways to choppy range is offing. The index is moving in the range of 6,130 and 6,415 since the first week of December.Till this range gets resolved buy support sell resistance is best stratergy.
Nifty Gaps
For Nifty traders who follow gap trading there are 9 trade gaps in the range of 5300-6400
- 5285-5303
- 5448-5553
- 5680-5700
- 5780-5802
- 6030-5995
- 6092-6103
- 6141-6145
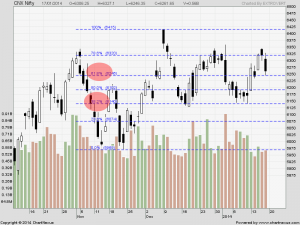
Fibonacci technique
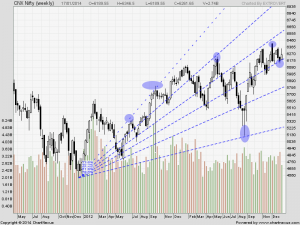
Fibonacci fan
Nifty Fibonacci fan are wonderful tool to find the top and bottom in short term.Nifty made the life high of 6417 at resistance of Fibo Fan,took exact support at 6130.
Nifty took the exact support at 61.8% retracement, next week looks crucial if 6241-6245 range is held bounceback else we can see a pullback till 6200.
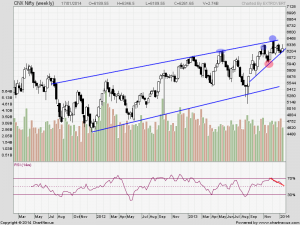
Nifty Weekly Chart
It was bullish week, with the Nifty was up by 90 and gaining 1.5% closing @6262.If follow up downmove does not come we can see a swift rise so stay cautious in trade. This is what we discussed last week and saw a swift bounce back
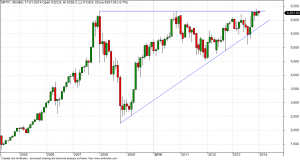
Trading Monthly charts
Triple top on Monthly chart which is bearish pattern.
Nifty Trading Levels
Nifty Trend Deciding Level:6266
Nifty Resistance:6337,6415 and 6460
Nifty Support:6230,6185 and 6140
Levels mentioned are Nifty Spot
Let me go by Disclaimer these are my personal views and trade taken on these observation should be traded with strict Sl
Want to see post in your Inbox,Register by adding your email id in Post in your Inbox section
Follow on Facebook during Market Hours: https://www.facebook.com/pages/Brameshs-Tech/140117182685863

What is ‘Chopad’level?