Bears after ruling the Dalal Street from past 5 weeks got a knock out punch from Bulls as they were able to rally 4% . Dow Jones at Life time high, Europe at 2008 High and Japan above 12000 propelled the risk on rally and nifty also rallied with its peers. Week ahead promises to be more fast-paced action as share market will await the factory output data on Tuesday and inflation on Thursday, which are expected to set expectations ahead of the central bank’s monetary policy decision on March 19. Moody’s prophesy that the worst may be over for the Indian economy and that it could grow at 7 per cent from 2014 also helped improve the sentiment on the street.
Last week we gave Trend Deciding level as 5765 Nifty as soon as Nifty moved above it achieved all the weekly targets. Traders following Weekly trend deciding level should have minted good money and should have avoided taking shorts.
Nifty Hourly Chart
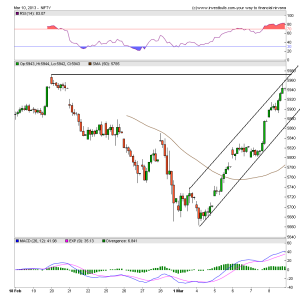
Hourly charts are trading in a perfect up trending channel after making low of 5664. Rally again got started with a gap up and added more fire after moving above 50 Hour SMA and is now trading at upper end of channel. Unable to close above 5971 pullback till 5900 should be expected.
Nifty Gaps
For Nifty traders who follow gap trading there are 3 trade gaps in the range of 5700-6000.
- 5699-5722
- 5784-5795
- 5863-5883
Nifty Daily Chart
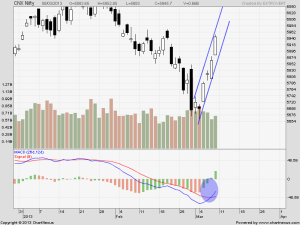
Nifty daily chart bounced from the red line support level as seen in below chart. Its approaching the 8 months old trendline which it broke in feb, Resistance comes at 6041 odd levels. This trendline can put a break on to the risk on rally which we are witnessing.
Nifty Daily Chart with Indicators
Positive Divergence which we discussed last week, atlast showed its effect with a explosive move. MACD is giving BUY signal and Nifty is trading in a perfect upward channel with support at 5883.
Fibonacci technique
As discussed earlier Fibonacci fan helps in finding potential tops and Bottom of market from short term prospective.We have used Weekly chart and applied Fibo Fans, Nifty was able to close above the Fibo Fans support of 5880 which is negative signs for Bears, Next level of resistance comes at 6000
Fibo Retracement
As per of Fibo Retracement theory Support at 5672
which is at 5942, from 5664-6112. Closing above this on weekly basis will add more fuel to fire.
Nifty Weekly Chart
Trading Monthly charts
Monthly chart declined after taking resistance at 6112. Till Nifty does not cross 6034, Monthly charts will remain bearish.Monthly chart are now near important trendline support of 5672 as discussed last week and Nifty made a low of 5664 and bounced back. Analyzing Higher time is always beneficial for positional traders.
Nifty Trading Levels
Nifty Trend Deciding Level:5971
Nifty Resistance:6038,6084 and 6120
Nifty Support:5883,5848 and 5801
Levels mentioned are Nifty Spot
Let me go by Disclaimer these are my personal views and trade taken on these observation should be traded with strict Sl
We do discussion is Live market to update Nifty levels If you are interested you can LIKE the page to get Real Time Updates.
Follow on Facebook during Market Hours: https://www.facebook.com/pages/Brameshs-Tech/140117182685863


Food for traders
Thanks a lot
sir,
your analysis are great and very helpful. thanks a lot for your selfless services for the small and immature traders. keep it up
prasan jain
Dear Sir,
Great Analysis as always, very useful.
Regards,
Dinesh
Thanks a lot !!
Rgds,
Bramesh