The market was buffeted by strong gusts of news-flow last week from political drama. First Mamata Di’s no confidence motion kept traders on edge and disruption and no functioning of parliament was a double blow to market sentiments.With a slew of bills on economic reforms slated for passage in the winter session, such adjournments are not likely to go down well with either domestic or foreign investors. Also an important development with SEBI discontinuing mini nifty futures from January 2013.
Next week is truncated week with Index Future Expiry for November series and Trading Holiday on 28 Nov.Lets discuss Nifty Trading Strategy for Futures expiry week.
Nifty Hourly Chart
Nifty Hourly charts is trading in the range of 5548-5643 last week . 50 HSMA is at 5603, Nifty traders holding longs keep this as SL for shorts.
Nifty Gaps
For Nifty traders who follow gap trading there are 6 trade gaps in the range of 5077-5600.
- 5043-5077
- 5238-5309
- 5303-5309
- 5399-5415
- 5435-5526
- 5666-5651 (Gap Filling can happen this week)
So these levels should be noted down carefully by Nifty trader to find further Nifty support and resistance.
Nifty Daily Chart
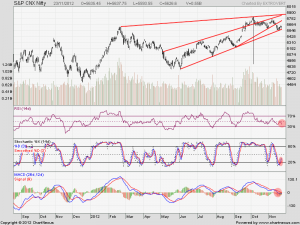
Nifty trend as per daily chart is sideways with range between 5548-5666. A broke the swing low of 5585 and made double bottom at 5548 and Fridays fall took support at 5593 which is rising trendline support.
As per trend line analysis Nifty is regularly taking support at rising trendline from low of 4770. Till the trendline does not get broken nifty can continue its upward journey.
Nifty Daily Chart with Indicators
RSI is approaching the support of 30, MACD is in SELL and Stochastic bounced from the oversold zone.
Moving Average forecasting method
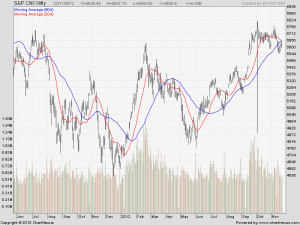
As per moving average forecasting method Both 20 and 50 MA are converging at 5653 and 5654 and it always lead to a big move. So tighten you seat belts for a breakout or breakdown trade.
Continue Reading for Weekly Charts and Weekly Levels
Let me go by Disclaimer these are my personal views and trade taken on these observation should be traded with strict Sl
We do discussion is Live market to update Nifty levels If you are interested you can LIKE the page to get Real Time Updates.
Follow on Facebook during Market Hours: http://www.facebook.com/pages/Brameshs-Tech/140117182685863


hai i am happy to read your nifty weekly analysis wery good one
Helloo BRAMESH JI , NICE ANALYSIS AND GREAT WRITING , YOIU HAVE INDICATED OF GAPS EXISTING IN THE NIFTY ( I PRESUME IT TO BE SPOT ) FROM THE LEVELS OF 5043 & ABOVE . SHOULD I IMPLY THAT ALL GAPS IN NIFTY (SPOT)FROM 5043 & BELOW ARE FILLED … I WILL MUCH APPRECIATE IF YOU CAN THROW SOME LIGHT ON THIS ISSUE ALSO , BECAUSE I AM HOLDING A FEELING AND OPINION THAT THERE ARE AS YET GAPS IN SPOT NIFTY BETWEEN 4824 & 5043 . I WILL BE MUCH OBLIGED IF YOU CAN CLEAR MY DOUBT AND ENLIGHTEN ME TO THE CORRECT STATUS ….
WARM REGARDS ,
PRADEEP K BUBNA
Dear Sir,
Yes there are atleast 4 gaps below 5000 and you can see my Sep month analysis for them. As nifty is trading well above 5000 i have removed them for time being,
Rgds,
Bramesh
Good Evening Sir,
I was eagerly waiting for your weekly analysis. Some big move is in making. Finally we may be out of this range.
Thanks
Thanks a lot sir!! Yes it seems
Rgds,
Bramesh