Fibonacci technique
Fib retracements
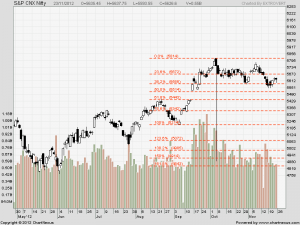
Fibonacci Ratios are drawn in above chart from 5217-5815 showing fibonacci support and fibonacci resistance. 5585 was broken but nifty closed above 5585 on Weekly basis . fibonacci resistance comes at 5652-5672 range.
As discussed earlier Fibonacci fan helps in finding potential tops and Bottom of market from short term prospective. If we see the chart closely Nifty has formed a swing top at 5815 as discussed .Now NS has Fibonacci resistance at 5652-5672 which was support on previous occasion as per previous Fibonacci fan.
Nifty Weekly Chart
Nifty was up by 0.92% WoW basis, and bounced from trendline support of rising trendline. Weekly High of 5718 will continue to act as strong resistance for the upmove.
Trading Monthly charts
Close above 5217 is bullish for market for rest of year.Support on Monthly charts comes at 5514 and resistance at 5661.The two-star formations in the monthly candlestick chart denote indecision. Since this occurs after a strong up-move from the low formed in June, Nifty trades ought to tread cautiously since there can be a break-out in either direction from these levels.
Nifty Trading Levels
Nifty Trend Deciding Level:5652
Nifty Resistance:5672,5701 and 5725
Nifty Support:5593,5548 and 5527
Levels mentioned are Nifty Spot
Read the Weekly Analysis Part I
Let me go by Disclaimer these are my personal views and trade taken on these observation should be traded with strict Sl
We do discussion is Live market to update Nifty levels If you are interested you can LIKE the page to get Real Time Updates.
Follow on Facebook during Market Hours: http://www.facebook.com/pages/Brameshs-Tech/140117182685863


