


FIIs Unleash a “Shock and Awe” Bearish Assault as a Market War Erupts
On May 12, 2026, the Nifty market became a historic battlefield. A catastrophic 443-point decline confirmed that the bears had seized absolute control. This was not a drift lower; it was a powerful, conviction-driven breakdown.
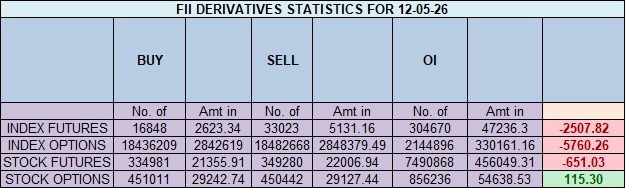
The institutional data reveals the engine of this collapse. Foreign Institutional Investors (FIIs) did not just lean bearish; they launched a full-scale “shock and awe” campaign, creating an unprecedented 16,564 new short contracts and culminating in a colossal net short position of 14,068 contracts.
However, the day’s most powerful and telling signal was that this institutional onslaught was met head-on by a tidal wave of retail buying, resulting in a historic surge in net Open Interest (OI) of 14,960 contracts. This is not the data of a simple sell-off. This is the definitive signature of a market at all-out war.
Decoding the Data: Two Armies with Absolute, Opposing Convictions
1. The FII “All-In” Bearish Fortress:
The FIIs’ actions were a testament to maximum possible bearish conviction.
-
Their creation of over 16,000 new shorts is an immense, aggressive bet that a significant market top is in place and a major crash is imminent.
-
This has cemented their positioning at a historic extreme: 12% long versus 88% short (ratio 0.12). This is a clear, institutional bet on a massive decline.
2. The Client “Peak Conviction” Bullish Stand:
In a stunning display of defiant optimism, the retail clients did not just meet the institutional selling—they overwhelmed it with bullish fervor.
-
They valiantly added a colossal 25,970 new long contracts, willingly and fearlessly absorbing the institutional supply and betting on a reversal.
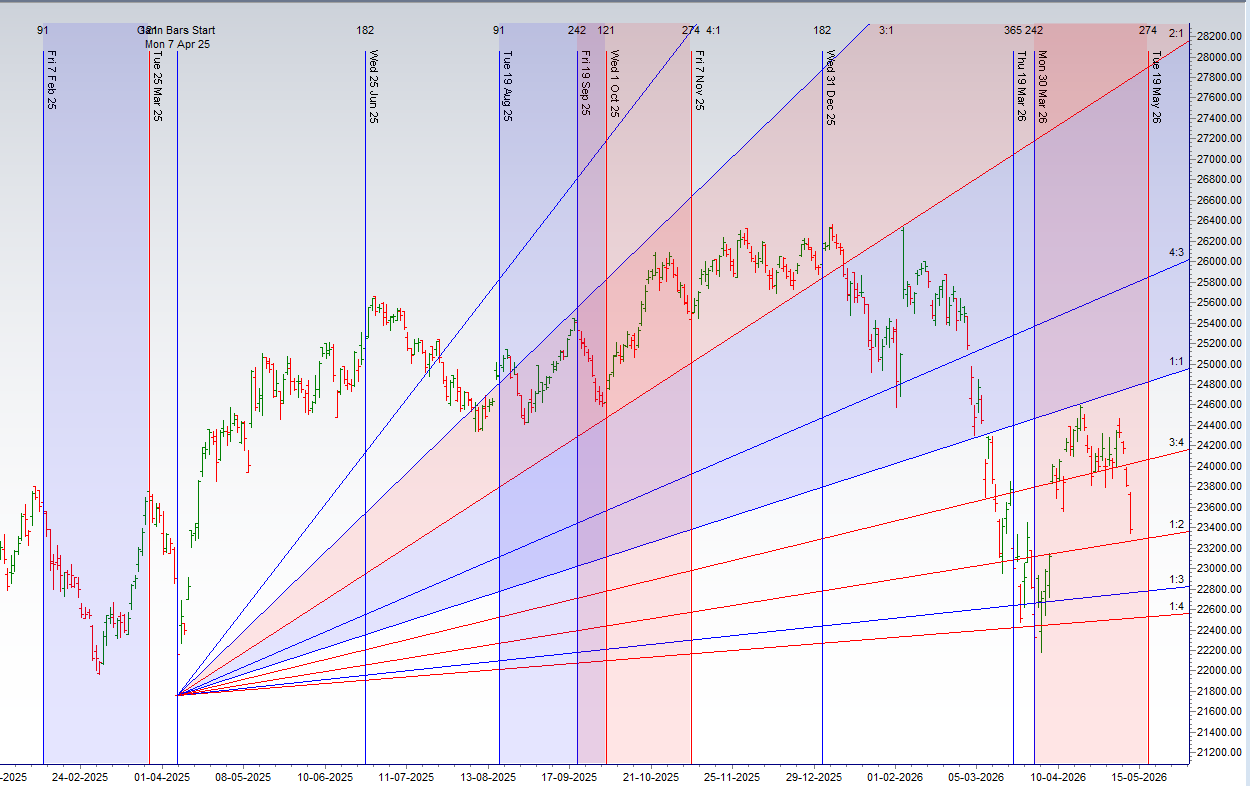
The Nifty has delivered another powerful and precise validation of our analytical model, executing a perfect decline exactly as laid out in our weekly forecast. The market has now arrived at a moment of supreme technical and cyclical significance. A backdrop of peak pessimism, fueled by elevated crude prices and sustained selling, is now being met by a powerful confluence of positive fundamental news and a major astrological bottoming signal. The stage is set for a high-stakes battle between established bearish momentum and a potent new catalyst for reversal.
The Dual Engines for a Trend Reversal
The case for a major bottom is now being built by two powerful, independent forces converging at the same time.
-
The Fundamental Catalyst (Lower Inflation): The catalyst for this is the positive surprise from the inflation data. The astrological reason for its impact is that it provides a tangible, logical (“Mercurial”) reason for a shift in sentiment. Lower inflation is a direct and powerful positive for the Indian economy, as it gives the RBI more room to maneuver and provides a strong tailwind for corporate profitability. This is the “good news” needed to spark a reversal from the lows.
-
The Astrological Catalyst (Mercury-Earth at Maximum Distance): Converging with this positive news is a major cyclical timing signal known for “bottoming formations.” The astrological reason this signals a reversal is that Mercury reaching its maximum distance from Earth marks a point of climactic extension and peak emotionality in the trend—in this case, peak fear. The market has reached its furthest point from “equilibrium,” which is the definitive signal that a sharp reversion to the mean (a rally) is the highest probability outcome.
The Leadership “Tell”: Reliance, Bharti, and IT Stocks
As your analysis correctly identifies, because Mercury is at the heart of this astrological event, the market’s leadership will provide the definitive “tell.” Mercury governs commerce and communication. Therefore, keep an exceptionally close eye on:
-
Reliance and Bharti: As giants in communication and broad commerce.
-
IT Stocks: As the pure-play sector for information and data.
IF these stocks begin to show strong relative strength and lead the market higher, THEN it is a powerful confirmation that the bullish energy of the Mercury cycle is taking hold.
The Definitive “If/Then” Battle Plan for Confirmation
This immensely powerful bottoming setup, a perfect confluence of price, time, and a fundamental trigger, must now be validated by price action. The battle for confirmation will be fought over a clear and precise price level.
The Bullish Confirmation Scenario
-
The Trigger: The bulls must capture the 23,400 level.
-
The Analysis: A decisive and sustained move above this level is the non-negotiable confirmation signal. It is the definitive proof that the bullish reversal energy has successfully overwhelmed the bearish momentum.
-
The Outcome: This action is poised to trigger a “fast rise” or short squeeze, with initial targets at 23,697 and the major psychological level of 24,000.
The Bearish Invalidation Scenario
-
The Trigger: The bulls fail, and the market achieves a decisive break below 23,323.
-
The Analysis: A break below this level is a definitive signal that the immensely powerful bullish setup has failed, a sign of profound and extreme market weakness.
-
The Outcome: This breakdown is poised to trigger a new and accelerated leg down towards 23,189 and 23,060.
Conclusion
The Nifty has arrived at a high-probability inflection point for a major bullish reversal. A perfect technical setup has aligned with both a positive fundamental catalyst and a powerful cyclical bottoming signal. The price action at 23,400 will provide the final verdict. Prepare for a pivotal and potentially high-velocity session where a new trend is poised to be born.
Nifty April Futures Open Interest Volume stood at 1.90 lakh cr , witnessing addition of 12.6 Lakh contracts. Additionally, the increase in Cost of Carry implies that there was addiiton of SHORT positions today.
Nifty Advance Decline Ratio at 03:47 and Nifty Rollover Cost is @22556 closed above it.
In the cash segment, Foreign Institutional Investors (FII) sold 1959 cr while Domestic Institutional Investors (DII) bought 7990 cr
The Nifty options market is radiating signals of extreme bearish control and a market operating under immense selling pressure. A profoundly negative Put-Call Ratio (PCR) of just 0.49 indicates that the open interest in call options is nearly double that of puts. This is the unmistakable signature of a market dominated by aggressive call writers, reflecting their high conviction that any attempt at a rally will be brutally suppressed.
This intense bearish pressure has pushed the market decisively below its financial center of gravity, the Max Pain point of 23,650. With the spot price trading significantly lower at 23,429, the index is in a position of extreme technical weakness, confirming the complete dominance of the sellers and reinforcing the market’s strong negative bias. This wide divergence creates a slight upward pull towards the Max Pain level, but it is being aggressively resisted by the bears.
The options chain clearly defines the high-stakes battlefield that has been established:
-
Resistance: A massive “Great Wall of Calls” is located at the 23,600 strike, which now acts as the primary and most formidable ceiling. This is the immediate and most critical test for any recovery attempt.
-
Support: On the downside, a significant support floor has been built by put writers at 23,300. The ultimate line of defense and psychological support is located at 23,000.
In conclusion, the Nifty is in a powerful bear grip, dominated by negative sentiment and overwhelming overhead supply. The path of least resistance is firmly sideways to down. The market is trapped, and any relief rally is poised to be sold into aggressively at the 23,600-23,650 zone, with the market’s structure favoring a retest of the 23,300 support.
Nifty Spot – Intraday Chart Observation
Technical Setup: The index is approaching critical breakout levels. Watch these zones for price action confirmation:
-
Strength (Upside): Momentum is expected to pick up if Nifty sustains above 23444. In this scenario, the immediate resistance levels are 23495 23555 and 23610
-
Weakness (Downside): The trend technically weakens if the index slips below 23323 This could open the path towards support levels at 23285, 23225 and 23189.
Wishing you good health and trading success as always.As always, prioritize your health and trade with caution.
As always, it’s essential to closely monitor market movements and make informed decisions based on a well-thought-out trading plan and risk management strategy. Market conditions can change rapidly, and it’s crucial to be adaptable and cautious in your approach.
► Join Youtube channel : Click here
► Check out Gann Course Details: W.D. Gann Trading Strategies
► Check out Financial Astrology Course Details: Trading Using Financial Astrology
► Check out Gann Astro Indicators Details: Gann Astro Indicators
Bramesh in your yearly price forecast based on astrology, 17th may is the important date for triggering shorts and big down side move, is that happened already ordered dates are different now?
ji