


Disclaimer : This analysis represents the highest-probability forecast derived from expert, multi-decade historical evaluation of astrological signatures and their documented correlation with market psychology and price action.
No Guarantee: This is not a guarantee of future market performance. Financial markets are influenced by numerous dynamic and unpredictable real-world factors. All trading and investment activities carry significant risk, including the potential loss of principal.
Educational Purpose Only :This content is strictly for informational and educational purposes and should not be construed as financial advice or a recommendation to buy, sell, or trade any financial instrument.
Consult a Professional :We strongly advise you to consult a qualified financial advisor before making any investment decisions. Any actions you take based on this analysis are solely your responsibility. We assume no liability for any financial profits or losses that may occur.
Gold: The Rahu Shadow Strike
- Act I (Start of Week): The Gann/Rahu Trap.
Gold enters the week at a critical Gann Dateand a Rahu Station. This will triggeran immediate expansion in the Average True Range (ATR). The “line in the sand” for bulls is the Monday opening range. IF Gold sustains a 1-hour close above Monday’s high, THEN a “Shadow Rally” toward major resistance is active. However, the “Why”—Rahu’s station—suggests this move is poised to be a deceptive “Bull Trap” designed to clear out shorts before a mid-week correction.
For a Detailed Astro Forecast with Neural Analysis Please watch the below video
MCX GOLD Gann Angle Chart
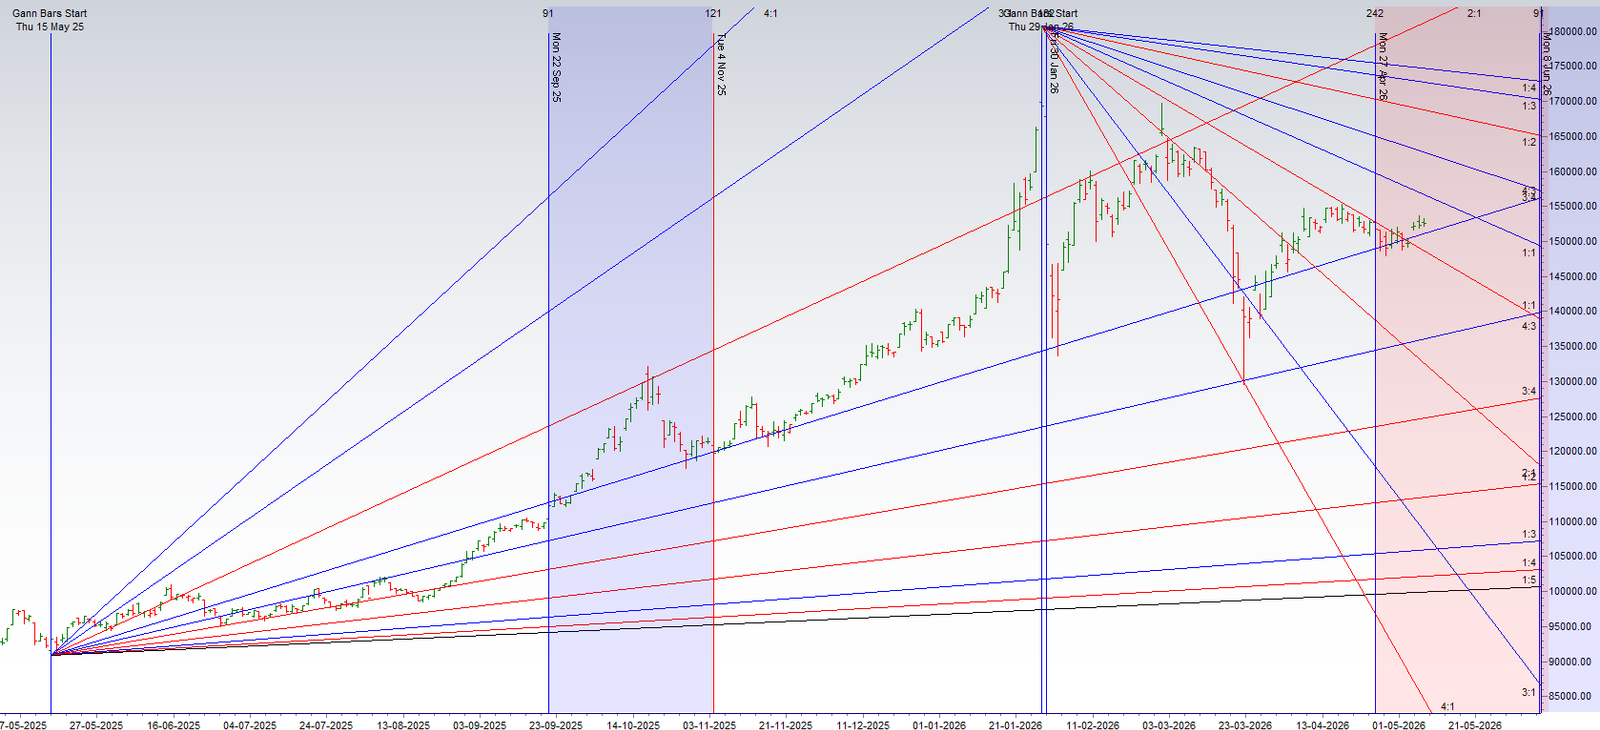
Gold has formed multiple small bars ready for a trend reversal and pullback
MCX GOLD Supply Demand Zone
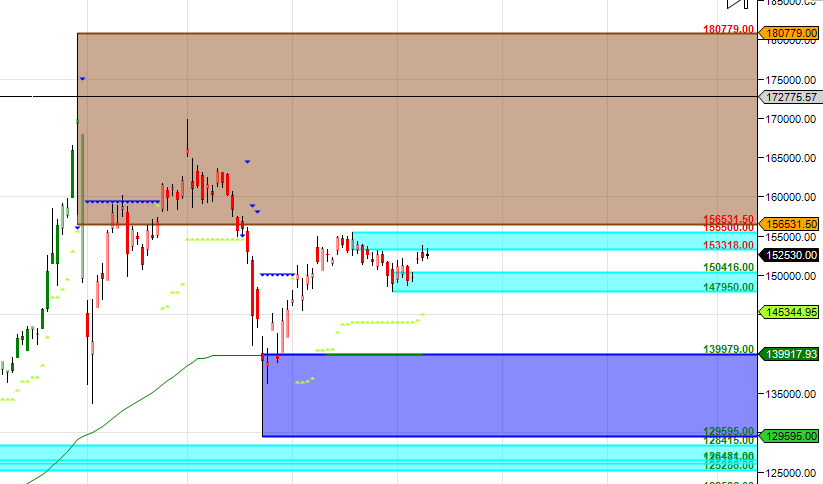
MCX GOLD Supply Demand Chart : Demand in range of 149-150 K , Supply in range of 154-155 K
MCX GOLD Harmonic Analysis
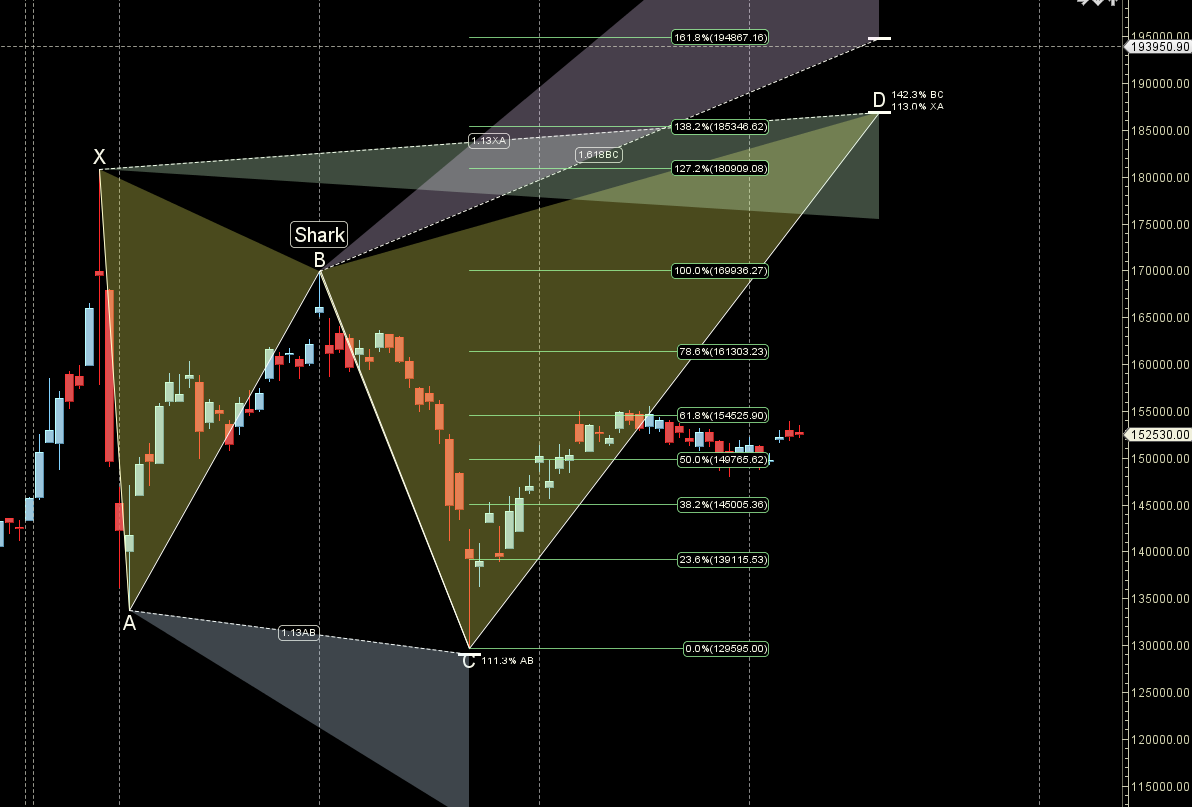
Unable to break 156K can lead to pullback to 152/151 K
MCX GOLD Weekly
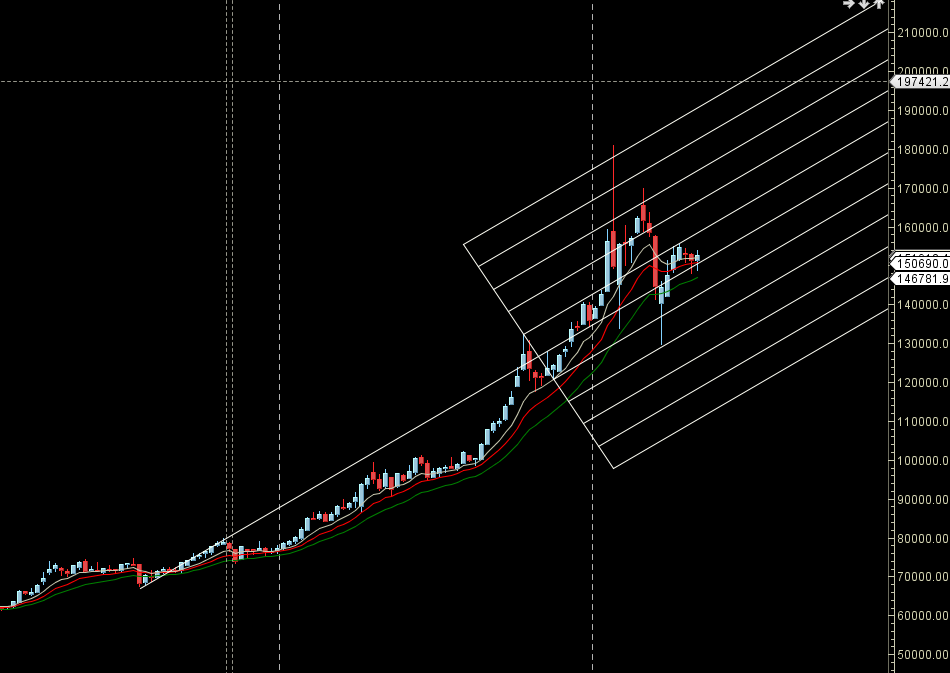
Gold has formed weekly DOJI
MCX GOLD Monthly
156 K Monthly Resistance and 150 K Monthly Support.
GOLD Astro/Gann Trend Change Date
Key Pivot Dates: Watch 21/23 April
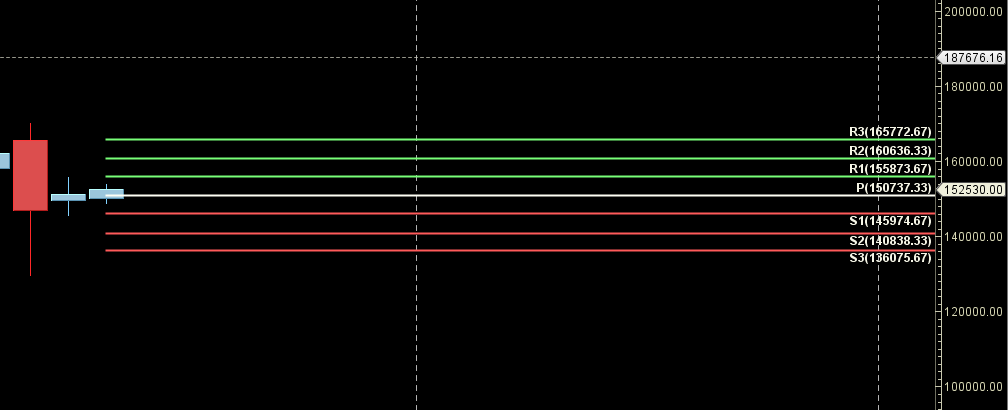
GOLD Weekly Levels
Weekly Trend Change Level:152602
Weekly Resistance: 153384 154168 154955 155743 156533
Weekly Support: 151821 151043 150267 149943 148720
Levels Mentioned are for Current Month Future
Learn More:
W.D. Gann Trading Strategies – Learn how to decode markets using price, time, and geometry.
Trading Using Financial Astrology – Discover how planetary motion impacts market behavior and how to trade it effectively.
Ready to Trade Like a Time-Master?
Join our one-on-one mentorship to master astro-timing, Gann analysis, and institutional-grade setups.