


A High-Conviction Breakout: FIIs Lead the Charge as New Money Floods into a Soaring Bank Nifty
On April 21, 2026, the Bank Nifty Index Futures market delivered a powerful, unambiguous signal of a major bullish breakout. The market’s internals and price action aligned perfectly to confirm that a new, high-momentum phase of the bull run has ignited. The index surged by a massive 805 points, a clear technical victory for the bulls.
This powerful price action was unequivocally driven by institutional conviction. Foreign Institutional Investors (FIIs) took a clear leadership role, accumulating a substantial 3,283 contracts. However, the session’s most powerful and profoundly bullish signal was the concurrent increase in net Open Interest (OI) of 1,693 contracts. This is not a short squeeze; this is the definitive signature of a healthy, expanding, and institutionally-backed bull trend.
Decoding the Data: The Anatomy of a Healthy Breakout
-
Price Action Confirms a Decisive Victory: The 805-point rally is definitive proof of a major technical event. Bulls have overwhelmed all sellers and established control.
-
The FIIs as the Confident Leaders: In this high-momentum environment, the FIIs were not hesitant; they were aggressive buyers. The astrological reason for their confidence is a market environment where major cyclical headwinds have cleared, allowing them to deploy capital with force. Their large-scale buying provided the institutional demand that absorbed all selling pressure and drove the market decisively higher.
-
The Open Interest “Stamp of Approval”: The catalyst for confirming this as a healthy trend is the rising OI. A rally on falling OI is weak and suspect. A rally on rising OI is a sign of immense health and strength. It proves that new, confident capital is actively flowing into the market to build fresh long positions. The FIIs’ buying, combined with other new bulls, was so strong that it not only absorbed all the day’s profit-takers but also forced the creation of 1,693 brand-new, active contracts.
Conclusion
The data from this session is a high-quality, unequivocally bullish signal. The powerful price action, clear FII leadership, and the strong growth in Open Interest all confirm that the Bank Nifty has entered a new, high-momentum phase of its bull market. The underlying dynamics are strong, suggesting the path of least resistance is now firmly upwards.
The Bank Nifty has delivered a powerful and resounding victory for the bulls, decisively resuming its uptrend after a brief, healthy pause. As forecast in our analysis, the market has staged a powerful rally, proving that the underlying bullish momentum is both strong and intact.
Now, having confirmed its strength, the market has arrived at a moment of supreme technical significance. The rally is not being met by random selling, but by a powerful, multi-layered “super-confluence” of Gann and traditional technical resistance. This is the first major, pre-calculated obstacle for this bull run, and the market’s reaction here will be critical.
1. The Multi-Layered Resistance Fortress
The current price level is not just a single resistance point; it is a high-density zone where multiple, independent technical methodologies are converging to create a formidable barrier.
-
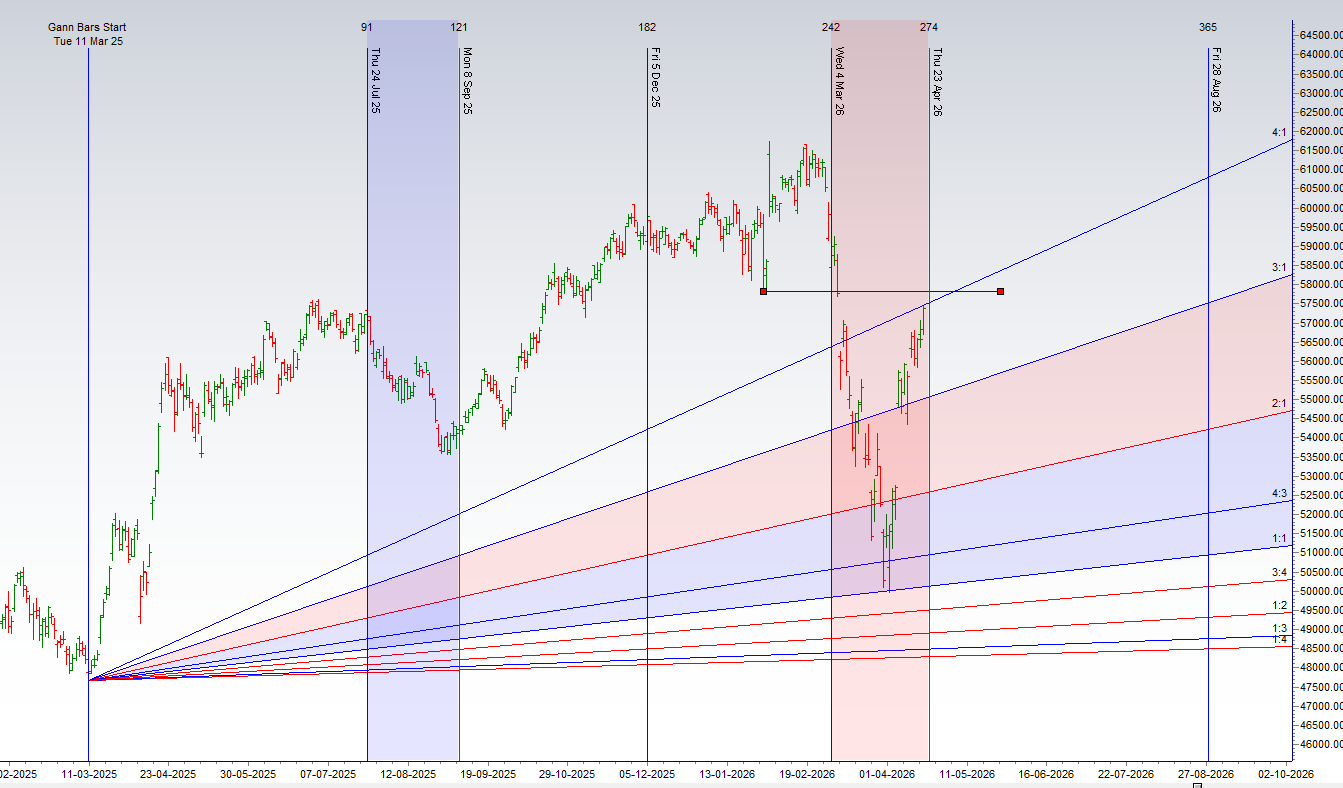
The Gann Angle Resistance: The price is now directly hitting the steep and powerful 4×1 Gann angle, a major source of geometric resistance.
-
The Gann Retracement Level: This angle is being perfectly reinforced by the 62.5% Gann retracement level at 57,371, adding a second layer of mathematical resistance.
-
The Moving Average Cluster: Compounding this Gann fortress is a dense confluence of moving averages located in the 57,300-57,900 range. This acts as a dynamic “magnet” of resistance, creating a thick and challenging “tricky zone” for the bulls to cross.
2. The Time Factor: A Cyclical Inflection Point Looms
Adding a layer of temporal tension to this price-based resistance is a critical timing signal. As your analysis identifies, April 23rd is an important time cycle date. This means the market is not just approaching a key resistance in price; it is approaching it at a key moment in time. The astrological reason for this significance is that pre-calculated time cycles mark moments where a trend’s energy is most likely to either peak and reverse, or to accelerate powerfully.
The Bullish and Bearish Scenarios
The Bullish Scenario (The Breakout)
-
IF the bulls can generate enough force to absorb the immense selling pressure at this confluence and achieve a decisive close above the 57,900 level, THEN it is a definitive signal of exceptional and overwhelming strength. The catalyst for this would be the sheer momentum of the trend, overpowering the structural resistance. This breakout is poised to trigger a new, accelerated up-leg.
The Bearish Scenario (The Rejection)
-
IF the rally stalls and is decisively rejected from the 57,371-57,900 zone, THEN it is a definitive signal that the “super-confluence” of resistance has won the battle. The catalyst for this is the successful defense by sellers at this key technical juncture. This rejection is poised to trigger a significant profit-booking move, potentially leading to a deep corrective pullback.
Conclusion
The rally has reached its moment of truth. The battle is no longer just about momentum; it is about the bulls’ ability to conquer a mathematically dense and formidable wall of resistance, all while a key time cycle is set to exert its influence. The price action at the 57,371-57,900 zone is the only thing that matters now. Prepare for a pivotal battle where the rally will either be validated or brutally rejected.
Bank Nifty April Futures Open Interest Volume stood at 17.7 lakh, with liquidation of 2.1 Lakh contracts. Additionally, the Increase in Cost of Carry implies that there was a liquidation of SHORT positions.
Bank Nifty Advance Decline Ratio at 12:01 and Bank Nifty Rollover Cost is @51053 closed above it.
Bank Nifty Spot – Intraday Technical Setup
Market Observation: The index is currently trading within a defined range. Traders should watch the following pivot zones for potential directional moves:
-
Strength (Upside): If the index sustains above 57450 , it indicates bullish momentum. The immediate resistance levels to watch are 57555 57666 57777.
-
Weakness (Downside): Selling pressure is likely to intensify if the index breaks below 57270 In this scenario, the next support zones are 57175 57050 56890
Wishing you good health and trading success as always.As always, prioritize your health and trade with caution.
As always, it’s essential to closely monitor market movements and make informed decisions based on a well-thought-out trading plan and risk management strategy. Market conditions can change rapidly, and it’s crucial to be adaptable and cautious in your approach.
► Join Youtube channel : Click here
► Check out Gann Course Details: W.D. Gann Trading Strategies
► Check out Financial Astrology Course Details: Trading Using Financial Astrology
► Check out Gann Astro Indicators Details: Gann Astro Indicators