


Disclaimer
This analysis represents the highest-probability forecast derived from expert, multi-decade historical evaluation of astrological signatures and their documented correlation with market psychology and price action.
No Guarantee
This is not a guarantee of future market performance. Financial markets are influenced by numerous dynamic and unpredictable real-world factors. All trading and investment activities carry significant risk, including the potential loss of principal.
Educational Purpose Only
This content is strictly for informational and educational purposes and should not be construed as financial advice or a recommendation to buy, sell, or trade any financial instrument.
Consult a Professional
We strongly advise you to consult a qualified financial advisor before making any investment decisions. Any actions you take based on this analysis are solely your responsibility. We assume no liability for any financial profits or losses that may occur.
Theme for Sensex: The Macro Breakout and the Time-Cycle Crucible
The theme for the broader indices is a spectacular, news-driven breakout that faces a definitive time-cycle test. The opening gap-up shatters near-term resistance, forcing a frantic chase for equities. The Sun entering Taurus supports this bullish repositioning in heavyweights. The indices will be driven higher early in the week, targeting major overhead supply zones. The narrative culminates on Thursday. The Multiple Gann Dates and the Uranian aspect act as a “line in the sand” for the bulls. IF the Nifty and Sensex fail to break and hold above the resistance levels established on Thursday, THEN a sharp, mean-reverting pullback becomes the high-probability outcome for Friday, confirmed by the Bayer Rules.
For a Detailed Day by Day Forecast with Neural Analysis Please watch the below video
SENSEX Harmonic Pattern
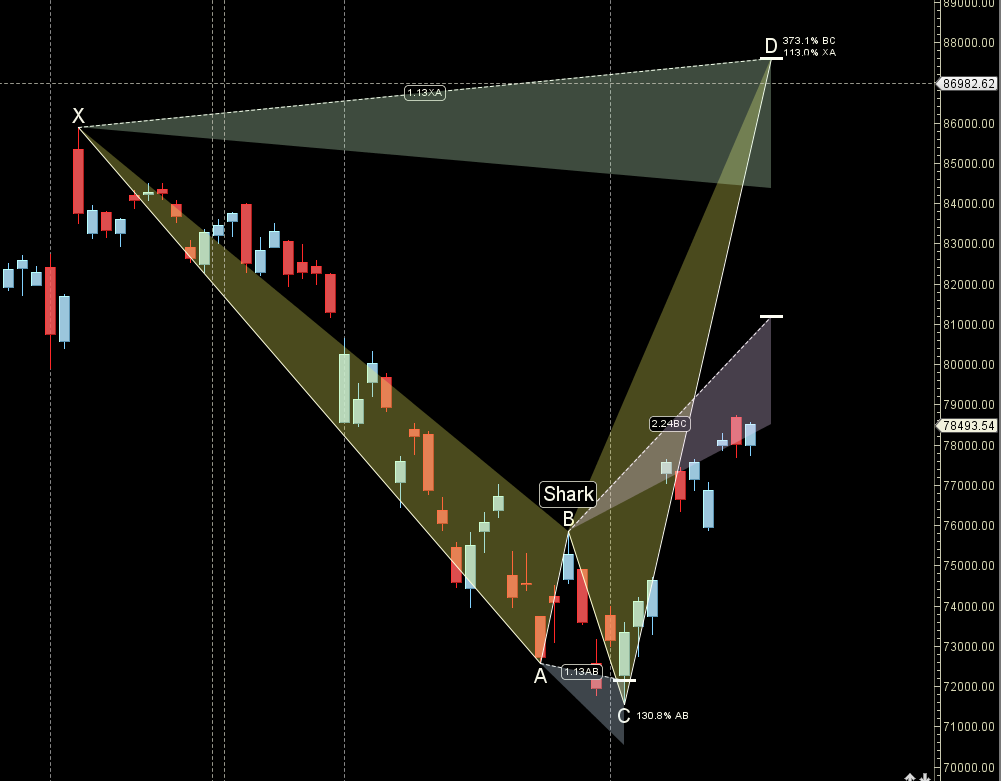
Till 76300 is held we can see upmove till 79000
SENSEX Gann Angles
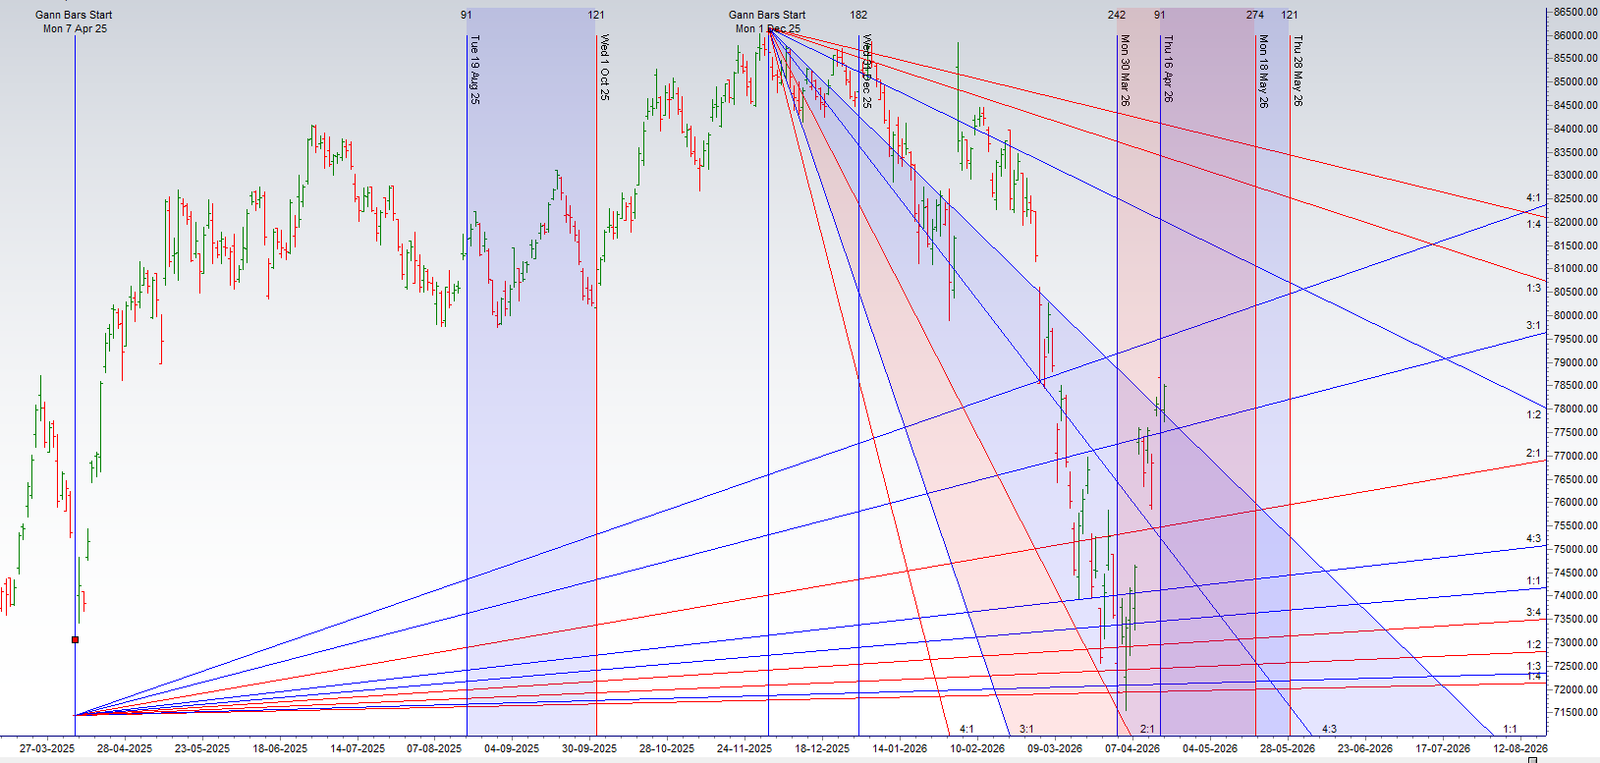
Sensex has held on to its 3×1 gann angle heading to 4×1 gann angle towards 79000/80000
SENSEX Supply and Demand
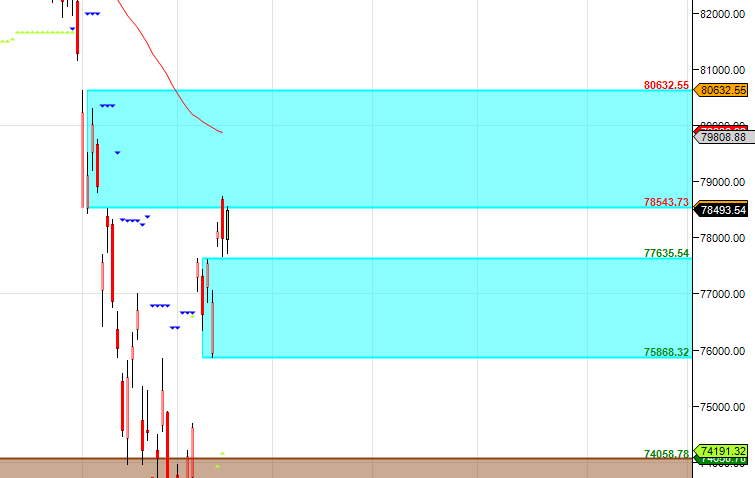
Self Explanatory Chart
SENSEX Time Analysis Pressure Dates
Key Pivot Dates: Watch 20/23 April
SENSEX Weekly Chart
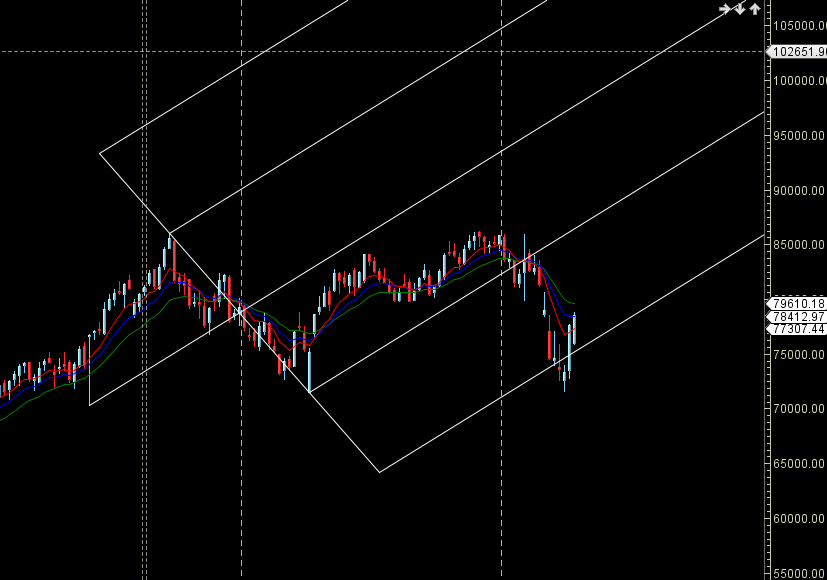
Sensex rallied big time from AF support zone range of 78400-78500 is supply zone.
SENSEX Monthly Charts
80500 is Monthly resistance zone 77800 is Support zone.
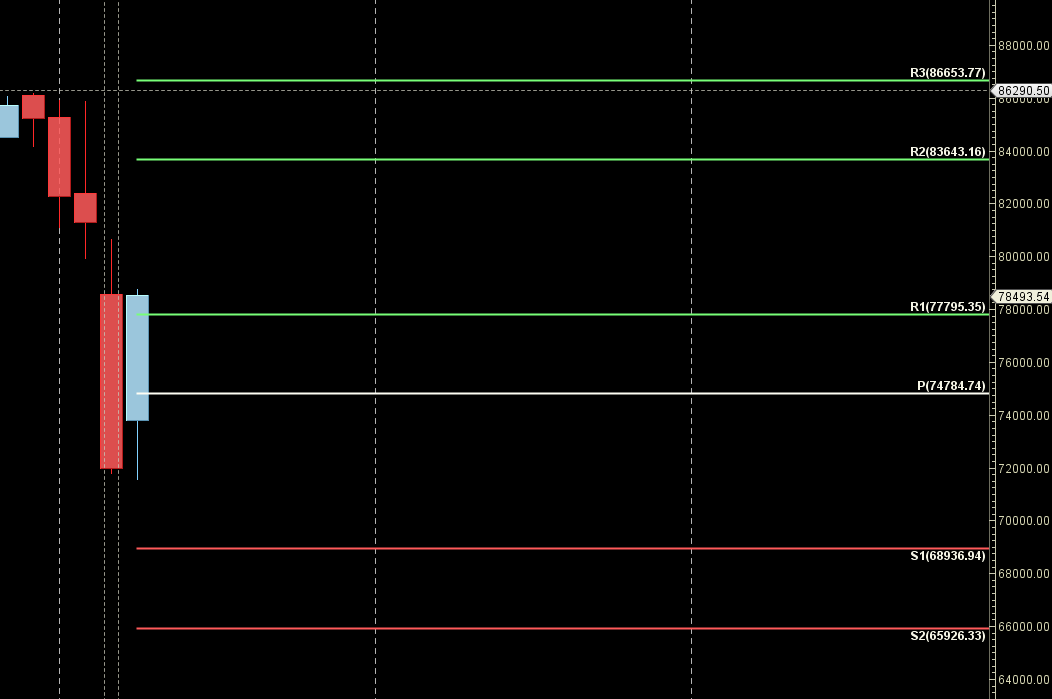
SENSEX Weekly Levels
SENSEX Trend Deciding Level: 78789
SENSEX Resistance: 79068 79347 79625 79904 80225
SENSEX Support: 78511 78232 77953 77674 77444
Levels mentioned are SENSEX Spot
Learn More:
W.D. Gann Trading Strategies – Learn how to decode markets using price, time, and geometry.
Trading Using Financial Astrology – Discover how planetary motion impacts market behavior and how to trade it effectively.
Ready to Trade Like a Time-Master?
Join our one-on-one mentorship to master astro-timing, Gann analysis, and institutional-grade setups.
Call: 09985711341
Email: bhandaribrahmesh@gmail.com