


A Deceptive Rally: The Anatomy of a Classic Short Squeeze
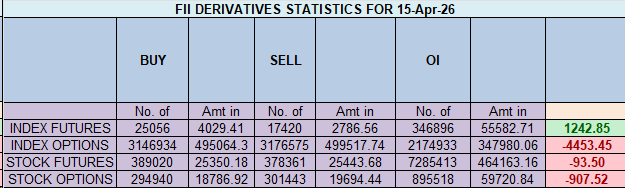
On April 15, 2026, the Nifty market delivered a powerful 379-point rally, giving the appearance of a major bullish reversal with strong institutional backing. The headline showed Foreign Institutional Investors (FIIs) as massive net buyers of 3,489 contracts. However, this surface-level strength is a profound deception.
The day’s most critical and revealing event was a colossal collapse in net Open Interest (OI), which plummeted by a staggering 19,529 contracts. This is not the signature of a new, healthy bull run. This is the unmistakable footprint of a violent, late-stage short squeeze, built on a foundation of profound trend exhaustion and participant capitulation.
Decoding the Data: The Mechanics of a Hollow Rally
1. The FIIs’ “Deceptive” Buy: This is a Massive, Profitable Exit, Not a New Entry
The headline “buy” figure is a classic misdirection. The granular breakdown exposes the FIIs’ true, brilliant strategy. The definitive signal that this was not a new bullish initiative is that they covered (bought back) a colossal 15,199 short contracts.
The astrological/cyclical reason for this action is that the market reached a point of climactic exhaustion where professional players saw the perfect opportunity to exit. The catalyst for their buying was the mass panic, which provided the ideal liquidity for a massive profit-taking operation. Simultaneously, they covered (sold) 7,563 long contracts, a de-risking move. They were not building a new bull case; they were cashing in their winning bearish tickets. Their overall positioning remains profoundly bearish at 22:78, proving they have not changed their core view; they have simply secured their profits.
2. The Main Event: The Great Unwinding & The Hollow Market
The most powerful signal is the massive OI collapse. A rally on collapsing OI is a hollow rally. The astrological reason a hollow rally is dangerous is that it lacks true “Jupiterian” expansive energy (new participation); it is a purely mechanical “Mercurial” unwinding of old contracts.
The Client behavior confirms this capitulation:
-
The Bullish Surrender: Clients covered (sold) a staggering 2,455 long contracts, a classic sign of capitulation where long-time holders can no longer stand the pain and are forced to sell.
-
The New Trapped Bears: Another group, convinced of the downtrend, added 1,360 new short contracts, becoming the fresh fuel for the ongoing squeeze.
This dual-sided exit is why the OI collapsed so violently. The market is “hollowing out.”
The Bullish and Bearish Scenarios
The (High-Risk) Bullish Scenario
-
IF the market uses the short-squeeze momentum to decisively break and close above a major overhead resistance of 24261-24300, THEN it is a definitive signal that new, genuine buyers are entering the fray, potentially forcing the remaining FII shorts to capitulate and turning the squeeze into a genuine new trend.
The (High-Probability) Bearish Scenario
-
IF the rally stalls at 24261-24300 and the volume of forced short-covering evaporates, THEN it is a definitive signal that the squeeze is over. The catalyst for the reversal is the exhaustion of the buyers themselves. The lack of a genuine foundation is poised to trigger a “rug pull” event, where prices collapse rapidly in the absence of real support, re-testing the recent lows.
Conclusion
Disregard the headline FII “buy” figure. The dominant story is the historic collapse in Open Interest, which signals this rally is a classic short squeeze. The FIIs are masterfully exiting their profitable short campaign, not leading a new bull charge. The market’s foundation is exceptionally weak and vulnerable. A break of key support, such as 23,409, is poised to invalidate the bullish momentum and confirm the bearish reversal.
The Nifty is currently in a state of profound and suspenseful consolidation, a classic “calm before the storm.” The market has delivered a powerful one-two punch of technical compression: not only did it form an NR21 pattern, confirming the narrowest trading range in 21 days, but it did so as a Doji candle. The formation of a Doji on an NR21 day is an exceptionally rare event, signaling a market in a state of perfect, high-tension equilibrium where volatility has been squeezed to its absolute minimum.
This powerful confluence is not happening by chance; it has occurred on a key astrological date—a Mercury Ingress—a time known for initiating new trends and shifting market communication. The astrological reason for this setup is that the Mercury Ingress acts as a “reset” button for market communication, forcing the indecision to resolve. The market has given its final, unambiguous warning that the period of quiet consolidation is over and that a major, directional move is imminent. As your analysis correctly identifies, this is a classic setup that provides a very good risk-to-reward trade.
The Definitive “If/Then” Battle Plan: The Triggers for a Major Trend
The extreme compression of the NR21 Doji has created an unambiguous and high-stakes battlefield. The immense energy stored within this pattern is poised to be unleashed in one of two directions, and the triggers are defined with mathematical precision.
The Bullish Breakout Scenario
-
The Trigger: IF Nifty achieves a decisive and sustained move above the 24,261-24,300 range.
-
The Analysis: This is the definitive signal that the bulls are in control and the immense stored energy has resolved to the upside. A break above this range confirms that the consolidation was a period of accumulation.
-
The Outcome: This action is poised to trigger a powerful, high-velocity rally towards 24,500 and a more significant target of 24,781.
The Bearish Breakdown Scenario
-
The Trigger: IF the bulls fail and the market achieves a decisive break below 24,108.
-
The Analysis: A break below this level is a definitive signal that the powerful NR21 consolidation has resolved to the downside, turning the Doji into a major reversal pattern.
-
The Outcome: This breakdown is poised to trigger a swift and powerful fall back towards the support levels of 24,040 and 23,900.
Conclusion
The Nifty is a powder keg. An exceptionally rare pattern of extreme volatility compression has aligned perfectly with a major astrological catalyst. This setup signals that a major directional move is imminent. The battle lines are drawn with absolute clarity. The side that wins this fight—either by conquering 24,300 or breaking 24,108—will likely dictate the market’s trend for the next several sessions. Prepare for a major expansion in volatility.
Nifty April Futures Open Interest Volume stood at 1.79 lakh cr , witnessing liquidation of 7.\ Lakh contracts. Additionally, the increase in Cost of Carry implies that there was closeuer of SHORT positions today.
Nifty Advance Decline Ratio at 47:03 and Nifty Rollover Cost is @22556 closed above it.
In the cash segment, Foreign Institutional Investors (FII) bought 666 cr while Domestic Institutional Investors (DII) sold 568 cr
The Nifty options market is radiating a strong and confident bullish sentiment, signaling that bulls have seized control and a firm support base has been established. A powerfully positive Put-Call Ratio (PCR) of 1.12 is the clearest evidence of this, indicating that total put open interest has decisively surpassed call open interest. This is a classic sign of a market that has shed its fear, driven by aggressive put writers who are confidently selling downside protection.
This bullish confidence has created a high-stakes battle right at the Max Pain point of 24,200. With the current price trading almost exactly at this level (24,214), the market is in a state of perfect “pinning.” This is a classic signature of large institutional sellers controlling the range, incentivized to keep the price anchored to maximize their profits from decaying volatility.
The participant data reveals a critical divergence fueling this stalemate:
-
Foreign Institutional Investors (FIIs) executed a classic “short strangle” strategy, acting as significant net sellers of both call and put options. They are selling volatility, betting the market will remain range-bound.
-
Retail traders are on the opposite side, acting as net buyers of both calls and puts, betting on a major breakout in either direction.
This has forged a clear and formidable battlefield:
-
Resistance: A massive “Great Wall of Calls” is located at the 24,500 strike, which serves as the ultimate ceiling.
-
Support: A powerful support floor has been built at 23,900, which holds the highest concentration of Put OI. The 24,200 Max Pain level itself will also act as a crucial pivot.
In conclusion, the Nifty is in a strong, institutionally-controlled pinning scenario. While the underlying sentiment is bullish, FIIs are betting on consolidation. The path of least resistance is sideways within the well-defined range of 23,900-24,500, and a major catalyst will be required to break this deadlock.
Nifty Spot – Intraday Chart Observation
Technical Setup: The index is approaching critical breakout levels. Watch these zones for price action confirmation:
-
Strength (Upside): Momentum is expected to pick up if Nifty sustains above 24300. In this scenario, the immediate resistance levels are 24343 24385 and 24444
-
Weakness (Downside): The trend technically weakens if the index slips below 24226 This could open the path towards support levels at 24176, 24125 and 24070.
Wishing you good health and trading success as always.As always, prioritize your health and trade with caution.
As always, it’s essential to closely monitor market movements and make informed decisions based on a well-thought-out trading plan and risk management strategy. Market conditions can change rapidly, and it’s crucial to be adaptable and cautious in your approach.
► Join Youtube channel : Click here
► Check out Gann Course Details: W.D. Gann Trading Strategies
► Check out Financial Astrology Course Details: Trading Using Financial Astrology
► Check out Gann Astro Indicators Details: Gann Astro Indicators