


A Battle Royale: FIIs Launch Bearish Assault as a New War Ignites in the Bank Nifty
On April 13, 2026, the Bank Nifty was the scene of a brutal, high-stakes war. The day’s price action tells a story of incredible volatility—an enormous 1268-point intraday range that ultimately resolved with the bears winning the day, securing a 340-point decline. This is not the signature of a trending market; it is the definitive footprint of a major inflection point, where two immense and opposing forces have fought a major battle.
The institutional data reveals the hidden mechanics of this epic tug-of-war. Foreign Institutional Investors (FIIs) decisively took the side of the bears, methodically shorting 1,544 contracts. However, the day’s most critical signal, confirming that this is the start of a new war, not the end of an old one, was the solid increase in net Open Interest (OI) of 1,332 contracts.
Decoding the Data: The Anatomy of a High-Stakes Battle
-
The Price Action: A Story of Unresolved Conflict: An 1268-point range that closes only 340 points down is a sign of immense conflict. It signifies that a powerful bearish assault (the initial plunge) was met by an equally powerful bullish counter-attack (the recovery off the lows). Neither side could deliver a knockout blow, resulting in a state of high-tension exhaustion.
-
The FIIs: The Aggressive Bears: The FIIs’ action shows their high conviction. They saw the intraday volatility and used the strength of the recovery off the lows as a prime opportunity to build new short positions, betting that the downtrend would ultimately prevail. They were a source of constant, methodical selling pressure.
-
The Main Event: The Open Interest Surge Confirms a New War: This is the most potent signal of all. A market falling on rising Open Interest is a definitive signal of a healthy, high-conviction bear trend taking root. It means that the new FII shorts were met by a wave of new, confident bulls who were willing to step in and buy. The market is not just selling off; new, fresh capital is pouring in on both sides to fight this battle. This is not exhaustion; it is escalation.
Key Implications for the Market
-
A New Era of Volatility has Begun: The massive OI surge is the definitive proof that the period of quiet consolidation is over. New, large positions have been built for a bigger move, guaranteeing that volatility will remain high.
-
A High-Conviction Stalemate: The market is now locked between two powerful, newly-established forces: the aggressive FII bears and the unseen, new “strong-hand” bulls. This has fortified major support and resistance.
-
The Day’s High and Low are Now Fortress Walls: The boundaries of the 1268-point range have now become the most important technical levels on the chart. They are the lines in the sand drawn by immense capital. A decisive break above the high will signal a major bullish reversal and short squeeze. A decisive break below the low will signal a powerful bearish continuation.
-
The Next Break will be Decisive and Powerful: Because so much new capital just entered the market, the resolution of this range is poised to be a powerful, sustained, and decisive trend.
Conclusion
The battle of April 13th was an epic one, and it has just begun. The aggressive selling of the FIIs was met by a new wave of confident bulls, resulting in a high-tension stalemate. The Bank Nifty is now perfectly balanced on a knife’s edge, coiling for its next major move. The direction of this new trend will be determined by the market’s ability to break the high or the low of yesterday’s massive range. Prepare for a continuation of this high-volatility warfare.
The Bank Nifty has just delivered one of its most dramatic and powerful reversal signals in recent memory. The session opened with a catastrophic 1200-point gap down, a classic signal of peak fear and capitulation. However, what followed was even more significant. This moment of maximum pessimism was met with a relentless wave of “good buying from the opening,” a powerful rejection of the lower prices that allowed the market to claw back the majority of its losses and close only 300 points down.
This price action is the definitive footprint of a major capitulation bottom. The final sellers were purged in the morning’s panic, and a new, powerful buying force has taken control. This technical reversal is now being powerfully amplified by a major astrological event known for initiating new, bullish trends.
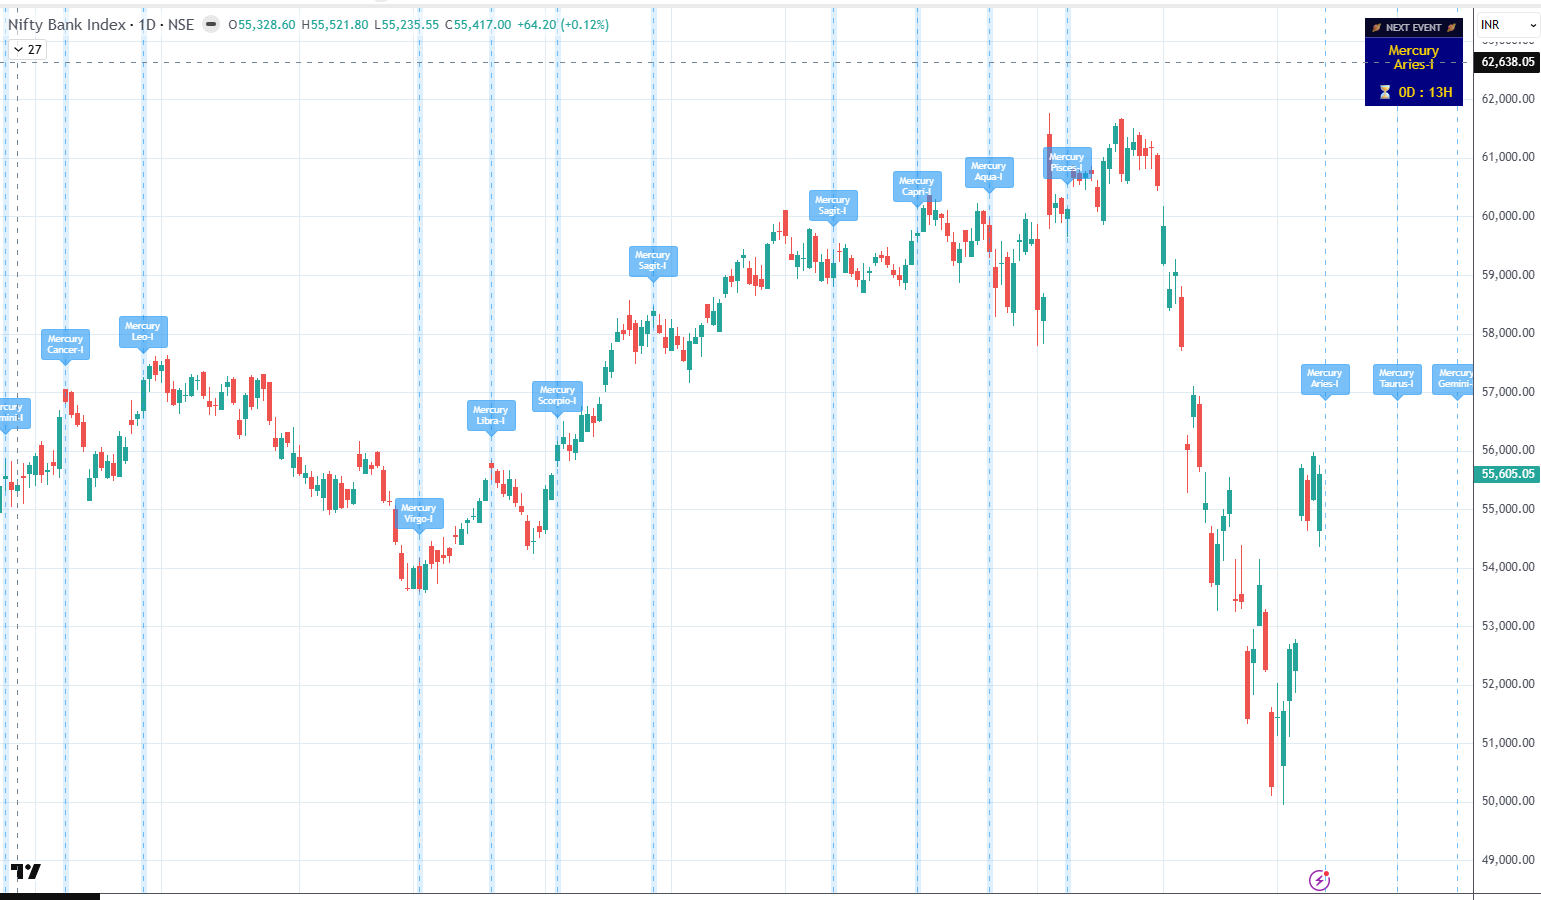
The Astrological Catalyst for a Bullish Trend: Mercury Enters Aries
The astrological reason for a new bullish move is clear and powerful: tomorrow, Mercury changes signs and moves into Aries. The catalyst for this bullish impulse is that Mercury (trading, thought, communication) is moving into a fire sign known for its speed, aggression, and new beginnings. This is a definitive shift from a cautious or bearish mindset to a forward-looking, “risk-on” psychology. This transit is poised to provide the powerful, impulsive energy needed to transform yesterday’s reversal into a sustainable, high-velocity uptrend. This is so powerful, in fact, that it suggests the market trend has definitively changed from “Sell on Rise” to “Buy on Dips.”
The Bullish Victory Lap: The Gap-Up and the Critical Test
The convergence of this technical capitulation bottom and a bullish astrological ingress now sets the stage for a major gap-up opening of 500-700 points. This gap is poised to represent the “victory lap” for the bulls, but it will immediately carry the market to its most important test.
The Bullish Confirmation Scenario
-
The Trigger: A decisive and sustained close above the 55,859 pivot.
-
The Analysis: A close above this level is the non-negotiable confirmation signal. It is the definitive proof that the bullish reversal is not just a one-day wonder but a genuine, sustainable trend change.
-
The Outcome: This action is poised to trigger the next major, powerful move towards the upside target of 57,336.
The Bearish Rejection (“Bull Trap”) Scenario
-
The Trigger: An inability by the bulls to achieve a close above 55,859.
-
The Analysis: A failure to conquer this level is a definitive signal that the powerful recovery was merely a short-covering squeeze and lacked genuine new buying conviction. It would turn the entire event into a massive “bull trap.”
-
The Outcome: This failure is poised to trigger a swift reversal and a fall back towards the support level of 54,383.
The Intraday Tactical Plan
For a day that is poised to open with a massive gap and be fueled by powerful impulsive energy, the tactical plan must be disciplined. The first 15 minutes’ high and low will be the ultimate, unbiased compass to navigate the initial volatility and confirm the session’s dominant trend.
Conclusion
A major capitulation bottom has been forged in the Bank Nifty. A powerful astrological catalyst is now set to provide the fuel for a new, aggressive bull trend. The focus has decisively shifted to “buying on dips.” The only battle that matters now is for control of the 55,859 pivot. A close above it signals the start of a major new up-leg. Prepare for a pivotal and high-momentum session.
Bank Nifty April Futures Open Interest Volume stood at 20.5 lakh, with liqudiation of 0.30 Lakh contracts. Additionally, the Increase in Cost of Carry implies that there was a closeuer of SHORT positions.
Bank Nifty Advance Decline Ratio at 02:012 and Bank Nifty Rollover Cost is @51053 closed above it.
The Bank Nifty options market is in a state of high-stakes, bullish tension, having staged a powerful breakout that is now defying the market’s cautious underlying structure. A near-neutral but slightly bearish Put-Call Ratio (PCR) of 0.92 indicates that call writers have been actively trying to cap the market, creating a structural headwind.
However, the most critical dynamic at play is the significant divergence between the Max Pain point, anchored far below at 55,400, and the spot price, which has broken out powerfully to 55,582. This is a highly bullish and unstable situation. It signifies that the bulls have successfully stretched the market far beyond its financial center of gravity, inflicting immense financial pain on the massive number of call writers who were defending the 55,500 and 55,000 strikes. This creates the classic conditions for a “short squeeze,” where these sellers could be forced to buy futures to cover their mounting losses, further accelerating the rally.
This powerful breakout has completely redrawn the market’s battlefield:
-
Resistance: With the primary call wall broken, the next major resistance level is likely located at 56,000, a major psychological strike.
-
Support: The former resistance fortress at 55,000-55,500 has now decisively flipped to become the new primary support floor. A close below this level would be required to negate the bullish breakout. The ultimate support for the current range remains the massive wall of Put OI at 52,000.
In conclusion, the stalemate is broken, and the bulls are in a commanding but potentially overstretched position. The market is in a classic “bullish breakout” phase, fueled by the pain of trapped call sellers. The path of least resistance remains upwards as long as the bulls can successfully defend the new 55,500-55,000 support fortress.
Bank Nifty Spot – Intraday Technical Setup
Market Observation: The index is currently trading within a defined range. Traders should watch the following pivot zones for potential directional moves:
-
Strength (Upside): If the index sustains above 55900 , it indicates bullish momentum. The immediate resistance levels to watch are 56119 56333 56555.
-
Weakness (Downside): Selling pressure is likely to intensify if the index breaks below 55800. In this scenario, the next support zones are 55666 55420 55225 .
Wishing you good health and trading success as always.As always, prioritize your health and trade with caution.
As always, it’s essential to closely monitor market movements and make informed decisions based on a well-thought-out trading plan and risk management strategy. Market conditions can change rapidly, and it’s crucial to be adaptable and cautious in your approach.
► Join Youtube channel : Click here
► Check out Gann Course Details: W.D. Gann Trading Strategies
► Check out Financial Astrology Course Details: Trading Using Financial Astrology
► Check out Gann Astro Indicators Details: Gann Astro Indicators