


A Tactical Hedge in a Strategic War: FIIs’ “Bullish” Action Masks a Deeper Story as Clients Capitulate
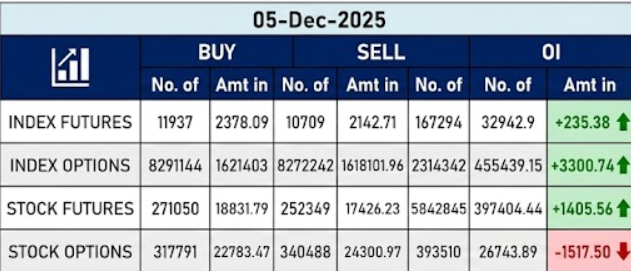
On December 5, 2025, the Nifty Index Futures market produced a masterpiece of deception and psychological conflict. While the headline shows Foreign Institutional Investors (FIIs) as net buyers of 1,060 contracts, to call this a “bullish stance” is to miss the entire story. The truth is far more complex and dangerous.
The session’s true, defining events were twofold: a mass capitulation of retail bulls, and the FIIs engaging in a complex tactical maneuver, all while the conflict intensified, confirmed by a significant increase in Open Interest of 1,510 contracts.
Decoding the Data: Unraveling a Complex Strategy
1. The FIIs’ Enigmatic Move: A Hedge, Not a Change of Heart
This is the most critical point to understand. The FIIs were not becoming bullish. Their overall, strategic positioning remains at a catastrophically bearish 13% long versus 87% short (ratio 0.15). So why the net buy?
-
They added 2,570 new long contracts, likely as a short-term tactical hedge against a potential sharp, news-driven rally ( from an RBI policy).
-
Crucially, they also added 1,342 new short contracts.
This is not the action of a new bull. It is the action of a deeply entrenched bear who is preparing for extreme volatility. They are holding their massive, strategic short position while simultaneously taking on a small, tactical long position to protect against a sudden, violent move against them. Their core bearish view is not only intact; it’s deeply fortified.
2. The Real Story of the Day: The Client Surrender
The session’s most significant and powerful signal came from the client segment. They finally broke.
-
They liquidated a massive 4,226 long contracts. This is a classic sign of capitulation, where the pain of a downtrend forces retail participants to sell their positions en masse, often right at the point of maximum pessimism.
-
Simultaneously, others in the client segment added 950 new short contracts, likely chasing the recent downtrend in a panic.
This is a monumental psychological shift. The primary buyers who had been supporting the market have now turned into sellers.
3. The Rising OI: Confirmation of a Building Conflict
Even with the mass exodus of over 4,000 retail longs, the overall Open Interest rose. This is a powerful signal that new, high-conviction money is pouring into the market. It confirms that the FIIs’ new positions are adding to the market’s total risk, building immense potential energy for a major breakout.
Key Implications
-
The FIIs are Prepared for Chaos: Their two-sided entry shows they are not predicting a calm market, but one of extreme, two-way volatility, which they are positioned to navigate. Their core strategic bet remains bearish.
-
The Risk has Inverted to a “Pain Trade” Upwards: With so many retail longs having now capitulated, the “fuel” for a further sustained decline is largely exhausted. The new “pain trade” is now a sharp rally that would punish the late-to-the-party retail shorts and put immense pressure on the FIIs’ colossal short position. The risk of a vicious short squeeze has increased dramatically.
Conclusion
Disregard the headline FII “buy” figure; it is tactical noise. The real story is the strategic capitulation of the retail bulls. This has created a classic end-of-trend setup. The FIIs are not turning bullish; they are managing their massively profitable bearish position in anticipation of extreme volatility. The selling pressure has likely peaked, and the market is now in a fragile, hollowed-out state where the risk of a sudden, sharp, and painful rally for the bears is exceptionally high.
Last Analysis can be read here
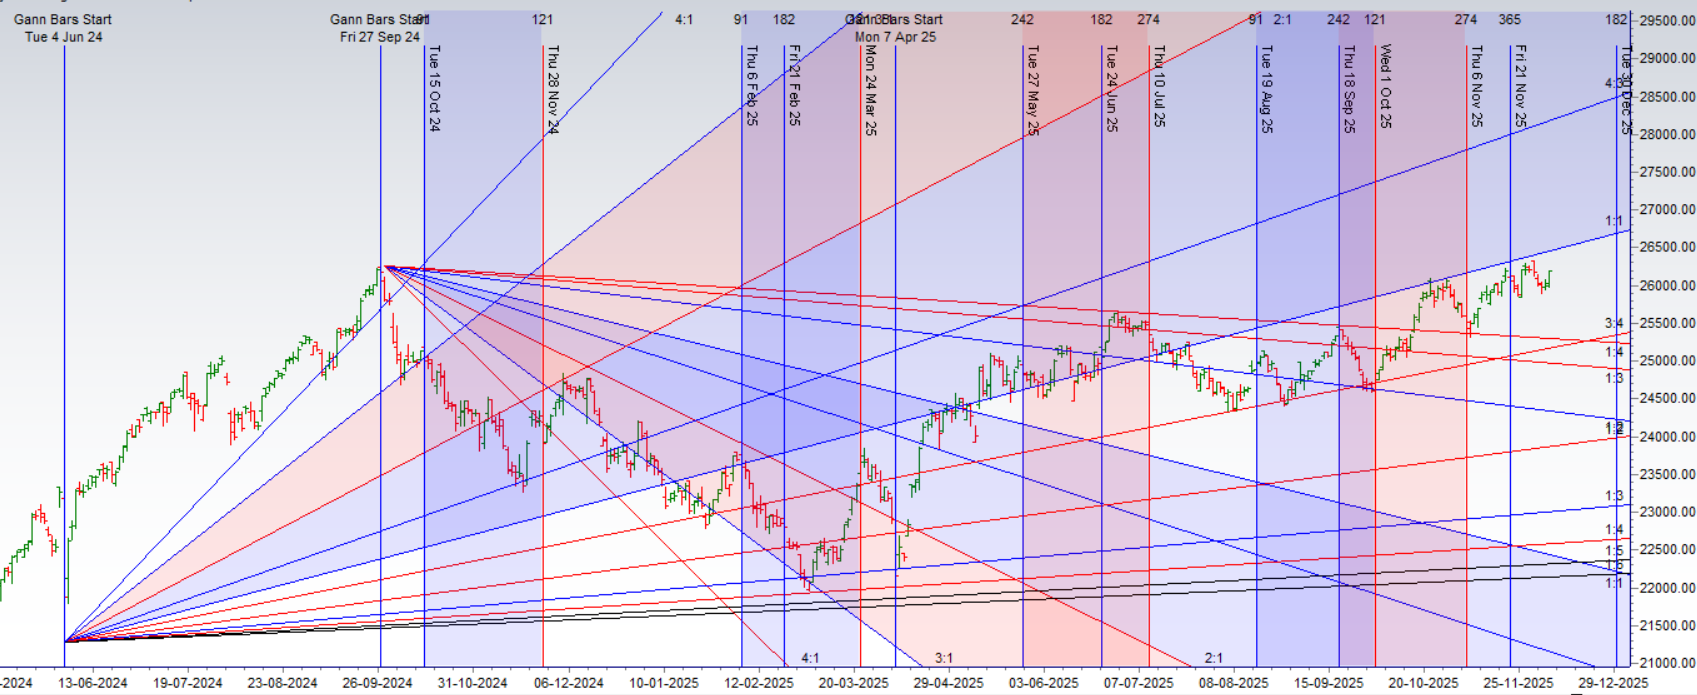
The market has responded with breathtaking precision to the recent confluence of powerful catalysts. The RBI’s 25 BPS interest rate cut unleashed a wave of liquidity, which acted as high-octane fuel for the market. This fundamental driver was perfectly timed with the peak emotional energy of the Full Moon and the decisive influence of the Venus-Mercury aspect, resulting in the major bullish move we anticipated. The bulls have successfully surfed this wave of positive energy.
Now, however, the environment is shifting dramatically. Having reached a state of high optimism, the market is now entering the influence of a new and formidable cyclical headwind: Bayer Rule 27.
The New Warning Sign: Bayer Rule 27 on the Horizon
This is not a minor aspect; it is a heavyweight indicator with a history of marking significant turning points. Bayer Rule 27, which correlates big market tops and bottoms with Mercury reaching an extreme geocentric speed (59′ or 1°58′), is now active. Its appearance after a powerful, liquidity-driven rally is a classic setup for potential trend exhaustion. The market has moved from a supportive cyclical environment to one that is now issuing a major warning of a potential reversal. The “easy money” phase of the rally is over, and the market is now on high alert.
The Decisive Technical Level: The Bullish Line in the Sand at 26,110
This powerful new reversal cycle now brings a single, critical technical level into sharp focus. The entire battle for control of the market’s trend will be fought and decided here:
-
The Bullish Control Level (26,110): This is the definitive line in the sand. So long as the bulls can protect and hold this level, they remain in command. The upward momentum is considered intact, and the market can continue to grind higher towards the next logical target zone of 26,325 – 26,358.
-
The Bearish Reversal Trigger (A Failure at 26,110): A failure to protect this support would be a profoundly bearish signal. It would indicate that the gravitational pull of the Bayer Rule 27 reversal signal is overwhelming the market’s bullish momentum. A break below this level would validate the cycle, likely triggering a quick and significant decline towards the next major support zone as the recent rally unwinds.
Conclusion
The market is on a high wire. The powerful, liquidity-driven rally is now directly confronting a potent cyclical signal known for marking major market tops. The situation has become a straightforward but high-stakes battle. The bulls’ entire case now rests on their ability to defend the 26,110 support level. Their success will pave the way for a continued rally. Their failure will signal that a major top is in and a deep correction is beginning. Watch this level with absolute focus—it is the pivot upon which the market’s next major trend will turn.
Nifty Trade Plan for Positional Trade ,Bulls will get active above 26212 for a move towards 26293/26373. Bears will get active below 26132 for a move towards 26051/25971
Traders may watch out for potential intraday reversals at 09:47,10:14,11:02,12:28,01:16 How to Find and Trade Intraday Reversal Times
Nifty Dec Futures Open Interest Volume stood at 1.47 lakh cr , witnessing liquidation of 3.7 Lakh contracts. Additionally, the increase in Cost of Carry implies that there was liquidation of SHORT positions today.
Nifty Advance Decline Ratio at 37:12 and Nifty Rollover Cost is @26320 closed below it.
In the cash segment, Foreign Institutional Investors (FII) sold 438 cr , while Domestic Institutional Investors (DII) bought 4189 cr.
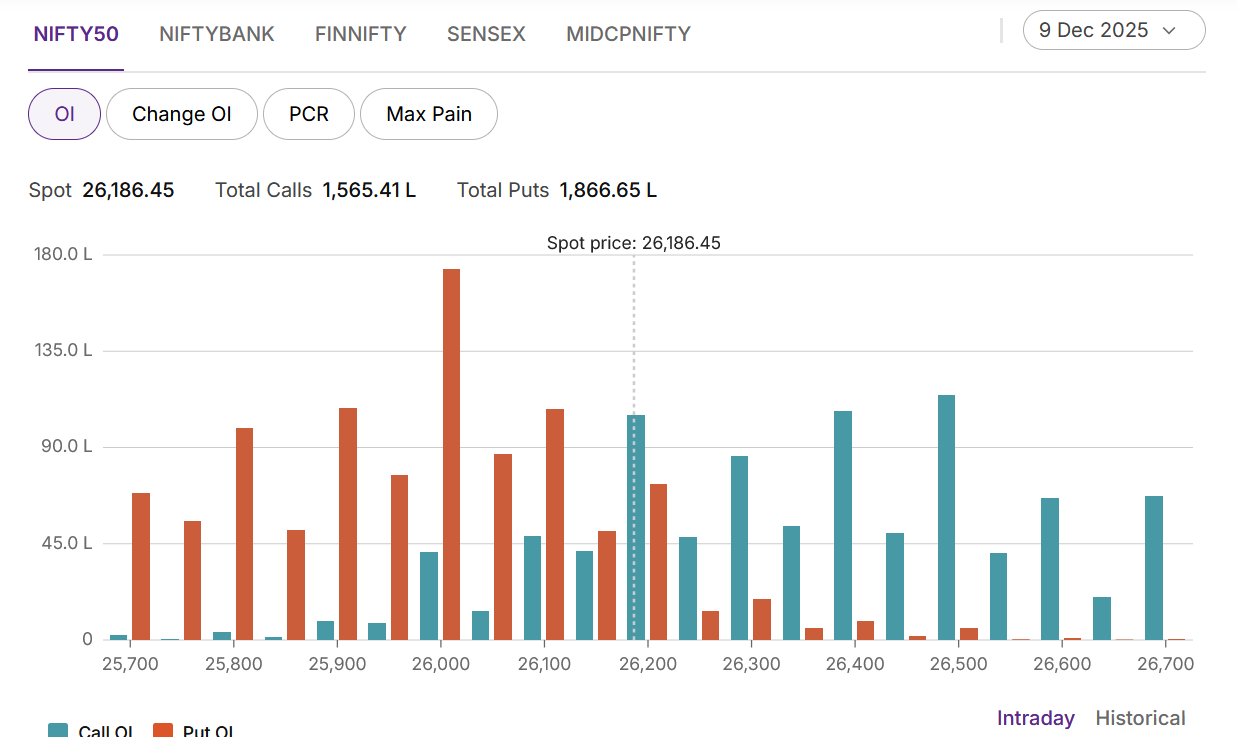
The Nifty options market is now displaying a powerful and decisive bullish bias, driven by a classic and stark divergence between confident institutional players and a fearful retail segment. An exceptionally strong Put-Call Ratio (PCR) of 1.19 signals a complete rout of the bears, with put open interest now massively exceeding calls. This is a clear sign that aggressive put selling is creating a formidable support structure beneath the market.
This bullish sentiment is structurally validated by the Max Pain point shifting higher to 26,150, establishing an elevated new pivot for the market and signaling that the expected trading range has moved decisively upwards.
The driving force behind this bullish transformation is the unambiguous activity of the Foreign Institutional Investors (FIIs). They executed a powerful, two-pronged bullish strategy: they were significant net buyers of call options (+38.6K contracts) while simultaneously being large net sellers of put options (-32.5K contracts). This dual strategy of buying upside exposure while creating a strong downside support floor is a sign of immense institutional conviction.
In a complete mirror image, retail traders acted out of fear. They were massive net buyers of put options (+120K contracts), purchasing the very “insurance” that the confident FIIs were selling to them.
This has firmly redrawn the market’s battle lines:
-
Resistance: Key resistance now lies at 26,200, with a more significant ceiling at the 26,500 strike.
-
Support: A powerful support floor has been built by the FIIs, with the 26,000 psychological level now acting as a major support base, followed by the ultimate floor at 25,800.
In conclusion, the Nifty is in a high-conviction, institutionally-led uptrend. While retail remains fearful, the FIIs are aggressively building a bullish structure, making a “buy on dips” strategy the most logical approach. The path of least resistance is now firmly to the upside.
For Positional Traders, The Nifty Futures’ Trend Change Level is At 26261. Going Long Or Short Above Or Below This Level Can Help Them Stay On The Same Side As Institutions, With A Higher Risk-reward Ratio. Intraday Traders Can Keep An Eye On 26280 , Which Acts As An Intraday Trend Change Level.
Nifty Intraday Trading Levels
Buy Above 26205 Tgt 26240, 26285 and 26323 ( Nifty Spot Levels)
Sell Below 26150 Tgt 26110, 26066 and 26022 (Nifty Spot Levels)
Wishing you good health and trading success as always.As always, prioritize your health and trade with caution.
As always, it’s essential to closely monitor market movements and make informed decisions based on a well-thought-out trading plan and risk management strategy. Market conditions can change rapidly, and it’s crucial to be adaptable and cautious in your approach.
► Join Youtube channel : Click here
► Check out Gann Course Details: W.D. Gann Trading Strategies
► Check out Financial Astrology Course Details: Trading Using Financial Astrology
► Check out Gann Astro Indicators Details: Gann Astro Indicators