


A Market Building Energy for a Downward Breakout: FIIs and Clients Turn Bearish in Unison
The Nifty Index Futures market on November 10, 2025, revealed a significant and ominous shift in sentiment. Foreign Institutional Investors (FIIs) not only maintained their extreme bearish stance but aggressively added to it, shorting a net 2,632 contracts worth ₹507 crore.
The most crucial piece of data, however, was the surge in net Open Interest (OI) of 2,924 contracts. This is a powerful signal of conviction. Unlike a downtrend on falling OI (which signals exhaustion), this indicates that new, high-conviction money is actively entering the market to build fresh short positions. The market isn’t just falling; it’s actively loading up for a bigger move down.
Decoding the Data: The Fracturing of Retail Conviction
A granular look at the activity reveals that the institutional bearishness is now being actively joined by a panicking retail segment.
1. The FIIs: Doubling Down on the Attack
The FIIs’ actions were a clear escalation. They weren’t just nudging their positions; they were actively building a new bearish structure:
-
They added a massive 4,873 new short contracts, a sign of supreme confidence in their bearish outlook.
-
Their long additions were negligible (257 contracts), indicating no interest in hedging or playing the long side.
Their final positioning is at an absolute extreme of 13% long versus 87% short (ratio 0.15). They are positioned with maximum conviction for a significant market decline.
2. The Clients: The First Signs of a Panic Flip
For the first time in this trend, the client segment’s actions have turned decisively bearish, marking a critical psychological shift:
-
The Capitulators: One group of clients finally threw in the towel, covering 581 long contracts, likely at a loss.
-
The Flippers: In a stunning move that mirrored the FIIs, another, much larger group of clients added an identical 4,873 new short contracts. This is a powerful sign of panic, where traders who were likely bullish are now flipping their positions to the short side, either to hedge their portfolios or to chase the downward momentum.
This creates a dangerous paradox. While the clients’ active flow for the day was overwhelmingly bearish, their legacy positioning remains extremely long at 69% vs. 31% (ratio 2.21). This is the most dangerous setup for the market: a massive, trapped base of old longs, with the newest retail participants now adding to the selling pressure.
Key Implications for Traders
-
High-Conviction Bearish Trend: The rising open interest is the market’s way of confirming that new, committed capital is driving this downtrend. This is not a weak trend; it is a strong, building one.
-
Retail Panic as an Accelerator: When the retail segment, which has been stubbornly bullish, finally begins to panic and add to the short side, it often acts as a powerful accelerant for the downtrend.
-
A Massive Base of Trapped Longs: The 69% of client positions that are still long are now in a highly vulnerable position. They represent the “fuel” for a potential liquidation cascade, where any further drop could trigger a fresh wave of forced, panicked selling from this group.
-
Rallies Will Be Met With Force: Any attempt at a relief rally will now face selling pressure from three distinct groups: FIIs adding to their shorts, panicking retail traders adding new shorts, and trapped legacy longs trying to sell at a less painful price. This creates a formidable wall of resistance.
The FIIs’ strategy is brilliant, brutal, and two-fold.
-
Phase 1 (The Pin): Use the options market to sell volatility, create a range, cap the upside (preventing a short squeeze), and lull the market into a false sense of stability. This pins the market while they quietly build their massive strategic short position in the futures market.
-
Phase 2 (The Attack): Once they are fully positioned and options expiry weakens the support floor, their objective will be to break the 25,500 support. This will trigger the wave of panic selling from the trapped retail longs, leading to a liquidation cascade that accelerates the downtrend, creating huge profits on their enormous futures short position.
Last Analysis can be read here
Om Shanti. Our heartfelt condolences and deepest sympathies go out to the families, friends, and all those affected by the tragic incident at the Red Fort.
May the departed souls rest in eternal peace, and may the injured find strength and a swift recovery. In this moment of sorrow, we stand in solidarity with the nation.
Om Shanti, Shanti, Shanti.
The market’s behavior in the last session was a textbook demonstration of the ongoing cyclical and technical forces at play. As forecast, the Gann angle support provided a floor, sparking a powerful morning rally. However, the session’s second half saw a complete sentiment reversal with significant profit booking, showcasing the classic volatile, erratic, and whipsaw nature of the Mercury Retrograde period, which is now in full effect.
This indecisive but highly volatile price action is a prelude to an even more significant event. Today, the planet Jupiter also begins its retrograde cycle. As an outer planet, Jupiter’s impact is often not a single-day shock but the beginning of a prolonged period of re-evaluation, trend reassessment, and potential reversals. With both the market’s key “timing” planet (Mercury) and its key “expansion” planet (Jupiter) now moving retrograde, the underlying theme is one of deep uncertainty.
News Events: The Perfect Catalysts for Chaos
This astrologically charged backdrop will now be met with major fundamental news events: the US-Indian Trade Deal and the Bihar Election results. In a normal market, the implications of these events might be clear. However, during a powerful retrograde period, the market’s reaction can be completely counter-intuitive. Good news can be sold, bad news can be bought, and initial moves can be violently reversed. These news items are now less about their fundamental impact and more about their role as catalysts for the inherent retrograde volatility.
The Definitive Battleground: The Scalper’s Range
This combination of forces has created a clear and definitive battleground. The market is coiled in a state of high tension between two critical levels. The area between these boundaries is not a zone for swing trading; it is a “no man’s land” or a “scalper’s range,” where quick, sharp, and unpredictable moves are to be expected.
-
The Bearish Breakdown Level (25,500): For the bears to regain full control and prove that the recent rally was a fluke, they must achieve a sustained break below this critical support. A move below this level would signal a continuation of the primary downtrend.
-
The Bullish Breakout Level (25,711): For the bulls, this is the line they must conquer to confirm a true reversal is underway. A decisive close above this resistance would validate the recent rally and suggest a new, sustainable uptrend is beginning.

Conclusion and Strategy
The market is in a state of extreme flux. The recent price action has confirmed the power of the active Gann and astro cycles. Now, with Jupiter Retrograde joining Mercury, and major news events acting as potential triggers, uncertainty is the dominant theme. The strategy must be one of extreme caution.
The key is to let the market prove its intention. Avoid taking large, high-conviction positions while the price is trapped between 25,500 and 25,711. Wait for a decisive, confirmed break of one of these boundaries to signal the market’s true direction. Until then, respect the retrograde chaos.
Nifty Trade Plan for Positional Trade ,Bulls will get active above 25636 for a move towards 25711/25795. Bears will get active below 25481 for a move towards 25401/25321
Traders may watch out for potential intraday reversals at 09:30,10:30,11:30,12:22,02:30 How to Find and Trade Intraday Reversal Times
Nifty Oct Futures Open Interest Volume stood at 1.85 lakh cr , witnessing liquidation of 1.7 Lakh contracts. Additionally, the increase in Cost of Carry implies that there was closuer of SHORT positions today.
Nifty Advance Decline Ratio at 32:18 and Nifty Rollover Cost is @26104 closed below it.
In the cash segment, Foreign Institutional Investors (FII) sold 4114 cr , while Domestic Institutional Investors (DII) bought 5805 cr.
Nifty in a State of Perfect Equilibrium as Option Sellers Pin the Market
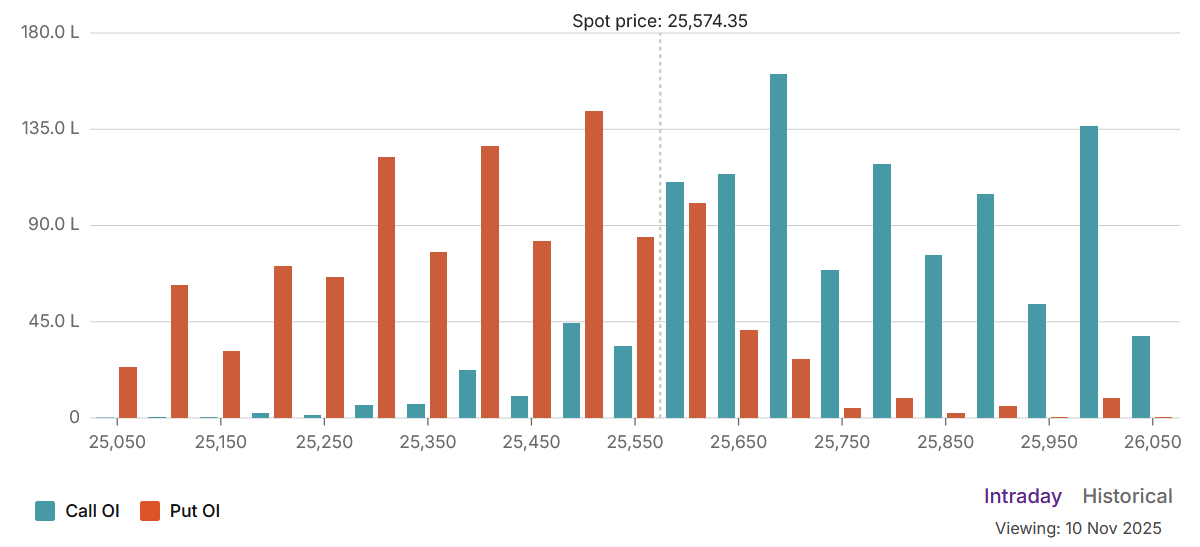
The Nifty options market is in a state of perfect, tense equilibrium. A Put-Call Ratio (PCR) of 0.95 signals an almost exact balance between bullish and bearish sentiment, a stark contrast to the fear or greed seen in trending markets. This neutrality is no accident; it is the calculated outcome of a market being powerfully pinned by institutional option writers. With the spot price at 25,574, hovering just below the Max Pain level of 25,600, the Nifty is trapped in a narrow gravitational field where option sellers are in maximum control.
The Option Chain Landscape: A Range-Bound Prison
The Open Interest (OI) chart clearly visualizes the prison walls that have been erected around the market.
-
The Resistance Ceiling: A towering wall of Call OI stands at the 25,700 strike, with another, even larger wall at 26,000. These levels represent a massive supply overhang where call sellers are betting with immense size that the market will not be able to rally past these points.
-
The Support Floor: An equally formidable floor of support has been built by put writers, with the largest concentration of Put OI located at the crucial 25,500 strike. This level is acting as a powerful magnet, preventing the market from any significant decline.
The market is, therefore, caught in a classic “iron condor” type of setup, tightly range-bound between the support at 25,500 and the initial resistance at 25,700.
Decoding the Players: The House vs. The Gamblers
The participant activity data reveals the strategy behind this market state, a classic battle between institutional sellers and retail buyers.
-
FIIs (The “House”): Foreign Institutional Investors are acting like a casino, selling volatility and betting on the market staying range-bound. They were net sellers of calls (net -22K), helping to build the resistance ceiling. At the same time, they were net sellers of puts (net -24K), constructing the support floor. This is a classic “short strangle” strategy. FIIs are not betting on a direction; they are betting that the market will stagnate, allowing them to collect the premium from options that expire worthless.
-
Retail (The “Gamblers”): In stark contrast, retail traders are betting on a breakout. They were net buyers of calls (net +66K), speculating on an upside move. They were also net buyers of puts (net +45K), speculating on a downside move. This is a “long strangle” strategy. Retail is buying volatility, betting that the market is about to make a large, directional move, but they are collectively uncertain about which direction it will be.
Defining the Key Levels:
-
Major Resistance: 25,700, followed by the ultimate ceiling at 26,000.
-
Central Pivot / Max Pain: 25,600.
-
Major Support: 25,500. This is the most critical floor. A break below this would inflict significant pain on put sellers and could trigger a rapid decline.
-
Secondary Support: 25,300 – 25,400.
Conclusion
The Nifty is in a textbook pinning scenario, orchestrated by institutional volatility sellers. The neutral PCR, the spot price’s proximity to Max Pain, and the FIIs’ strategy of selling both calls and puts all point to a market that is being deliberately kept within a tight range. The most probable outcome is a continued, low-volatility grind between 25,500 and 25,700. A major breakout in either direction would require an external catalyst powerful enough to overwhelm the massive positions of the institutional sellers and inflict serious financial pain, breaking the current stalemate.
For Positional Traders, The Nifty Futures’ Trend Change Level is At 25903. Going Long Or Short Above Or Below This Level Can Help Them Stay On The Same Side As Institutions, With A Higher Risk-reward Ratio. Intraday Traders Can Keep An Eye On 25535, Which Acts As An Intraday Trend Change Level.
Nifty Expiry Range
Upper End of Expiry : 25764
Lower End of Expiry : 25435
Nifty Intraday Trading Levels
Buy Above 25636 Tgt 25666, 25699 and 25729 ( Nifty Spot Levels)
Sell Below 25555 Tgt 25512, 24477 and 24435 (Nifty Spot Levels)
Wishing you good health and trading success as always.As always, prioritize your health and trade with caution.
As always, it’s essential to closely monitor market movements and make informed decisions based on a well-thought-out trading plan and risk management strategy. Market conditions can change rapidly, and it’s crucial to be adaptable and cautious in your approach.
► Join Youtube channel : Click here
► Check out Gann Course Details: W.D. Gann Trading Strategies
► Check out Financial Astrology Course Details: Trading Using Financial Astrology
► Check out Gann Astro Indicators Details: Gann Astro Indicators