


- FII’s bought 6.2 K contract of Index Future worth 365 cores 5.8 K Long contract were added by FII’s and 321 Short contracts were covered by FII’s. Net Open Interest increased by 5.5 K contract, so rise in Nifty was used by FII’s to enter long and enter short in Index futures.FII’s Long to Short Ratio at 1.43 How Comfortable you are with your trading ?
- As Discussed in Last Analysis As per Neural Analysis video we saw perfect bounce in nifty. Bulls will now get active above 11932 for a move back to 11987/12041. Bears will get active below 11870 for a move back to 11823/11769. THE MOST NEGLECTED TRADING DISCIPLINE
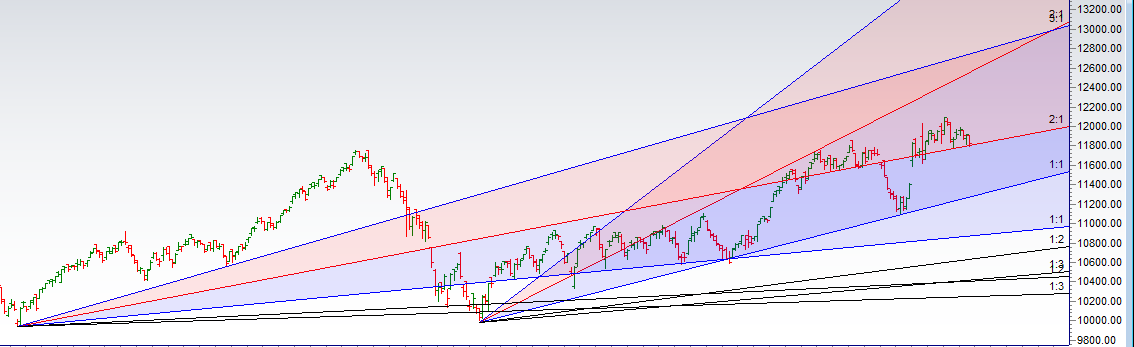
- High made was 11910 and bear 11870 bears had upper hand and pushed nifty towards 11823. We closed above the low made on 13 Feb, hence the possibility of bounce is still present. Nifty bulls need to close above 11847 for a move back to 11910/11987/12041. Bears will get active below 11769 for a move back to 11721/11666.
- Important intraday time for reversal can be at 11:12/12:43/2:05 How to Find and Trade Intraday Reversal Times
- Nifty June Future Open Interest Volume is at 1.84 core with addition of 0.97 Lakh with increase in cost of carry suggesting long position were added today, NF Rollover cost @11954 closed above it.
- Total Future & Option trading volume at 7.63 Lakh core with total contract traded at 1.08 lakh , PCR @0.92
- 12000 CE is having Highest OI at 24.4 Lakh, resistance at 12000 followed by 12100 .11000-11800 CE added 3.2 Lakh in OI so bears added position in range of 11900-12000.FII bought 13 K CE long and 11.8 K CE were shorted by them. DII bought 216 K CE and 145 K CE were shorted by them.
- 11800 PE OI@16.9 Lakhs having the highest OI strong support at 11800 followed by 11700 . 11000-11700 PE liquidated 0.14 Lakh in OI so bulls covered minor position in range 11700-11800.FII bought 12.9 K PE long and 589 PE were shorted by them. DII bought 24.5 K PE and 44.5 K PE were shorted by them.
- FII’s sold 238 cores and DII’s bought 376 cores in cash segment.INR closed at 69.79 Dollar to Rupee Forecast Lok Sabha Election Week
- Nifty Futures Trend Deciding level is 11864 For Intraday Traders). NF Trend Changer Level (Positional Traders) 11953 How to trade Nifty Futures and Bank Nifty Futures as per Trend Changer Level
Buy above 11830 Tgt 11859,11887 and 11915 (Nifty Spot Levels)
Sell below 11795 Tgt 11769,11743 and 11721 (Nifty Spot Levels)
Follow on Twitter:https://twitter.com/brahmesh
Follow on Facebook https://www.facebook.com/Brameshs-Tech-14011718268586
Youtube Channel: https://www.youtube.com/channel/UCxTIpotKybyOQIDsS3eEqhQ