


In Continuation with Previous Article
- Trade using TRIN
- Overbought and Oversold

As shown in above chart,For the S&P 500 Index between Feb 2015 and July 2015, a reading of 2.0 or higher typically indicated a short-term bottom was close at hand, and the price was due for at least a bit of upside movement.
Traders following TRIN would have been able to capture short term bottom in March and June.
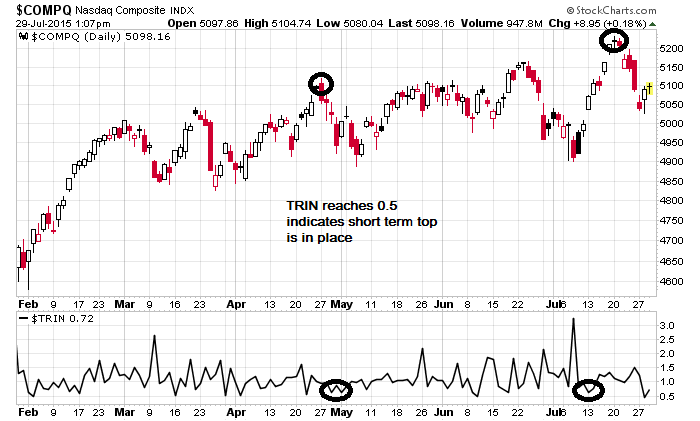
As shown in above chart,For the Nasdaq Index between Feb 2015 and July 2015, a reading of 0.5 or lower typically indicated a short-term top was close at hand, and the price was due for at least a bit of downside movement.
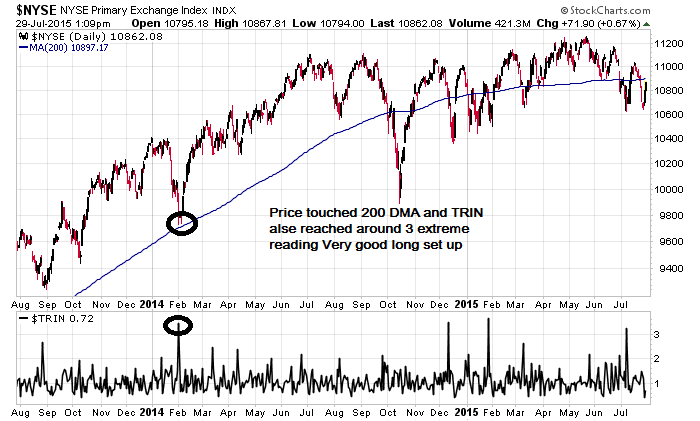
Use oversold levels on the TRIN to confirm entry points during an overall uptrend. Define the uptrend using a 200-day moving average. Look for the TRIN to reach 2.0 or higher to signal an oversold level in the price. Enter long as soon as the price starts to show strength again and the TRIN reverses back below 2.0. As shown in below chart a good Long entry set up was seen Feb 2014 when NYSE was trading near 200 DMA and TRIN reached around 3. Longs can be taken with stop loss below 200 DMA. Сайт – каталог индивидуалок: проститутки Самара Сохрани себе чтобы не потерять
The same approach is applied to a downtrend. Wait for rallies in price where the TRIN reaches 0.5 or below. Once the price begins to move higher, and/or the TRIN moves above 0.5, look to enter a short position with a stop loss just above the recent high.
- Trading Breakout using TRIN
TRIN can also be used to confirm breakouts in stocks,Ideally, when the price breaks higher, the TRIN should be below 1.0 to show there is buying pressure (but not below 0.5, as that would indicate the price may be overbought). Buy when the price breaks above the pattern.

Chart below shows the price breaking above a descending triangle pattern. Just prior to the breakout the TRIN was below 1.0 showing buying pressure, and at the point of breakout the TRIN is right near 1.0. This provided enough confirmation of the buying pressure to trade the breakout.This confirmation could have been used to enter a long position. Breakouts which occur in the direction of the overall trend, is more likely to give reward.
The same concept applies to downside breakouts. TRIN is above 1.0 just prior to or at the time of breakout, and ideally the breakout is in the direction of an overall trend.
Limitation of TRIN
Overbought and oversold levels are not exact levels. The TRIN can move well beyond these extremes before a price reversal occurs. Also, just because an overbought or oversold level is reached doesn’t mean the price will reverse.
The TRIN, as described here, is predominantly a short-term indicator, used by day traders and swing traders. It can be used as a longer term indicator if the data is smoothed and averaged, say over 4, 21 or 55 periods. This can be done by applying a moving average to the indicator, and then focusing on the moving average reading. Spikes will be smoothed out over a number of days and only the strongest overbought and oversold will appear using the TRIN moving average.
Given that it is naturally a short-term indicator, it is best to use the indicator in conjunction with overall trend analysis. Isolating the broader trend is up to the trader, but using a 200- or 100-day moving average can aid in finding the trend direction.
The indicator can have erratic movements and therefore may not be an ideal indicator to use for exiting profitable positions. The strategies above focus on getting you into a trending move; once that trend move has begun another method must be employed to exit the position with a profit.
Conclusion
Using the Arms Index (TRIN) can be a very useful part of any active day (and swing) trader’s toolkit of trading indicators, when used properly. It provides immediate market breadth long-short bias that can be used to improve discipline and directional trading entry skills.
Sir thank you for the link .
Welcome 🙂
Couldn’t we use TRIN for stocks other than NIFTY or index?
Which site provides the facility to calculate TRIN in a chart?
Sir,
Thank you for valuable insight on TRIN. Can you please suggest where do I find this TRIN chart for Indian securities. Nifty, B Nifty? I have searched some sights but cant find TRIN for Indian stocks.
Thank you
For NIfty you can use this http://nsetrin.blogspot.in/
Stocks need to write a program in Amibroker
Where to get TRIN for nifty?
Sir,
Like to have an article on RVI in combination with RSI.
sure will work over it
Sir, is there website which can telk us trin like chartink or anyother?
http://nsetrin.blogspot.in/ use this site for getting the TRIN for nifty