


Last Week Chopad Level of 6207 dictated the trend and nifty did 1 target on downside.In the coming week, Q3 results of major index heavyweight TCS, Axis Bank, Bajaj Auto, HCL Technologies, HDFC Bank, Reliance Industries, ITC and Wipro will come out next week.Inflation based on consumer price index will come out on Monday, while that based on wholesale price index will be announced on Wednesday..Lets analyze how to trade next week in data heavy week.
Nifty Hourly Chart

Nifty Hourly charts last week we mentioned Bullish move only above 200 SMA@6250.Nifty made the high of 6239 and turned back :). View remain the same any move above 6250 will be bullish,
Nifty Daily Chart
Nifty closed below 50 SMA on weekly basis which is very bearish, but whats missing in waterfall decline which generally comes on weekly close below 50 SMA. If next week we do not see momentum on Downside a swift up move can be seen. Time analysis also worked perfectly with nifty giving volatile move on 10 Jan
Nifty Gaps
For Nifty traders who follow gap trading there are 9 trade gaps in the range of 5300-6400
- 5285-5303
- 5448-5553
- 5680-5700
- 5780-5802
- 6030-5995
- 6092-6103
Fibonacci technique
Fibonacci fan

Nifty Fibonacci fan are wonderful tool to find the top and bottom in short term.Nifty made the life high of 6417 at resistance of Fibo Fan,took exact support at 6130. Now next week will decide the exact trend of market.Any break below 6130 can see a swift downmove to 5925 Holding the same we can see a up move to fresh life highs.
 The reason for swift fall, today was golden ratio 6245. Fibo Retracement also signalling support @6140 range. Bearish below that only.
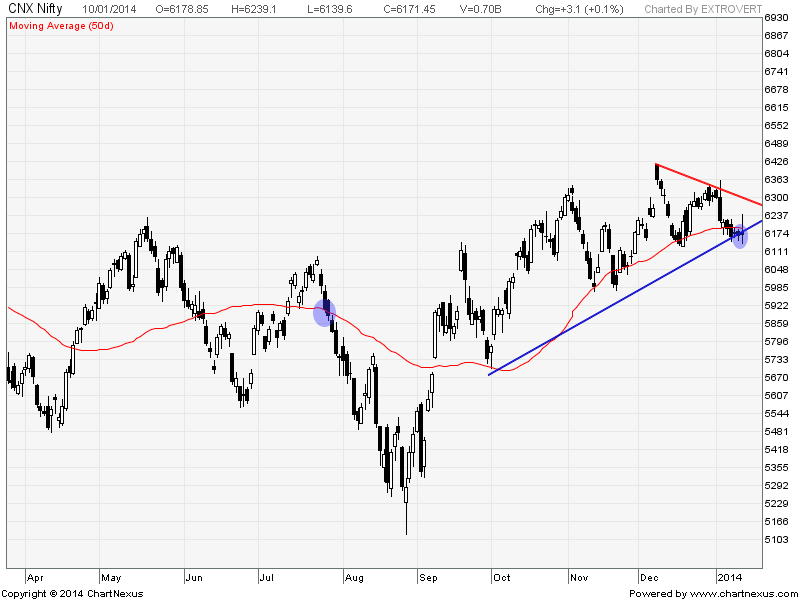
Nifty Weekly Chart
 It was bearish week, with the Nifty was down by 39 and losing 0.6% closing @6172. Nifty broke its weekly trendline which is bearish, Next week we need to see a follow up move.If follow up downmove does not come we can see a swift rise so stay cautious in trade.
Trading Monthly charts

Triple top on Monthly chart which is bearish pattern.
Nifty Trading Levels
Nifty Trend Deciding Level:6183
Nifty Resistance:6244,6298 and 6337
Nifty Support:6128,6060 and 5995
Levels mentioned are Nifty Spot
Let me go by Disclaimer these are my personal views and trade taken on these observation should be traded with strict Sl
Want to see post in your Inbox,Register by adding your email id in Post in your Inbox section
Follow on Facebook during Market Hours: https://www.facebook.com/pages/Brameshs-Tech/140117182685863
Dear sir,
I am a newbee in share market and I am in learning phase. I am a regular visitor of your posts. And learning a lot from them. Your blogs are very professionally written and very easy to understand. Your last blog on FEAR was really encouraging. Thank you for sharing all these knowledge and Please keep posting in future.
Please excuse for typo, Sent from mobile.
Thanks !!
Rgds,
Bramesh