


Stock market on Friday the biggest drop in about two years on fears of capital controls being imposed by the Reserve Bank of India and indicators of slowing economic growth has fuelled concerns about a potential sovereign downgrade. We Won Best Stock Blog Award : The Indian Bloggers Award 2013 (IBA)
Last week we gave Trend Deciding level as 5592 Nifty Nifty achieved 2 target on on downside and 2 Target on upside :).
Recently we started course on Stock Positional calls and MCX trading and what a week we had, Students made more than 1 lakh in last week :), A message to students please do not get carried by there profits , as we need to work on consistency and protecting our profits. Do remmber the trading psychology session i gave 🙂
Nifty Hourly Chart

Nifty Hourly charts trading took exact resistance at the lower falling trendline, and gave the much expected fall. Downward falling trendine comes as low as 5400 odd levels.
Nifty Gaps
For Nifty traders who follow gap trading there are 1 trade gaps in the range of 5400-6000 and all other gaps got filled.
- 5486-5447
- 5742-5716
Nifty Daily Chart
Nifty after forming double bottom,rallied on upside but unable to cross the upward rising trend line as shown in below chart. 4 days on upside got retraced in single session suggesting,faster retracement of rise bears in full control of market.Nifty showed biggest fall in 2 years suggesting.Till 5784 is not crossed on upside bears are in full control of market.

Fibonacci technique

As per of Fibo Retracement theory Nifty has taken support at 50% retracement and bounced above it. Holding the range of 5484-5474 bounce till 5664 can be seen.
Fibonacci fan

Nifty Fibonacci fan are wonderful tool to find the top and bottom in short term.The above chart is self explanatory 🙂
As per Nifty Chopad levels close above 5556 will only be a booster for Bulls. Last week Nifty Chopad level of 5592 played the trick as we were able to capture both down move and upmove.
Nifty Weekly Chart
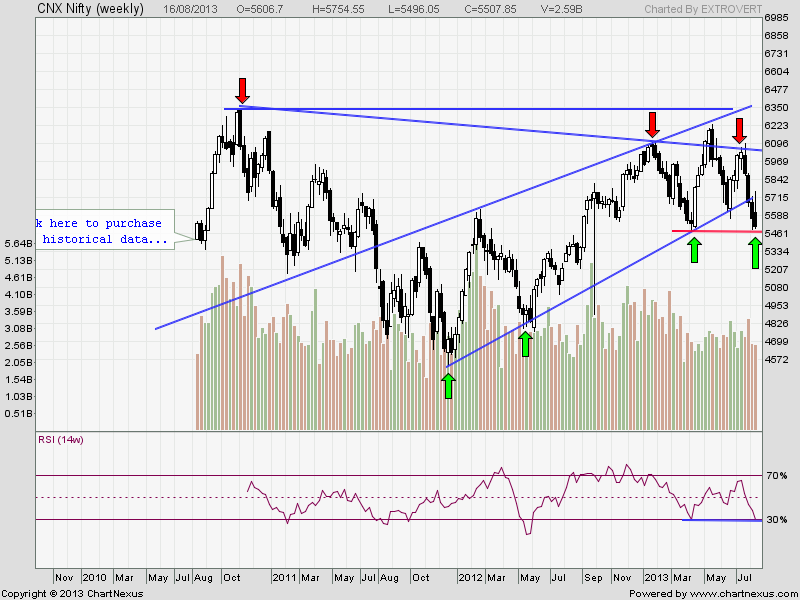
Trading Monthly charts

Monthly charts are near trendline breakdown zone. Will be get a breakdown or another whipsaw as was seen in breakout.
Nifty Trading Levels
Nifty Trend Deciding Level:5556
Nifty Resistance:5605,5686 and 5768
Nifty Support:5475,5426,5378 and 5296
Levels mentioned are Nifty Spot
Stock Performance sheet for June Month is updated on http://tradingsystemperformance.blogspot.in/
Let me go by Disclaimer these are my personal views and trade taken on these observation should be traded with strict Sl
Want to see post in your Inbox,Register by adding your email id in Post in your Inbox section
Follow on Facebook during Market Hours: https://www.facebook.com/pages/Brameshs-Tech/140117182685863
I read all the biogs. I have one question .on 16thAug EOD.5500 CE premium is 88 and 5600 PE Premium is 53. Actually both premium should be in parity. I am saying only about premiums. How to interprete this?
DEAR SIR,
WHAT IS RULE FOR USING THE NIFTY CHOPAD LEVELS AND HOW TO TRADE WITH NIFTY TREND DECIDING LEVEL. IS THIS STOP & REVERSE METHOD?
Congrats
Bramesh on the award
Keep it up .
Regards