


As discussed last week post USD-INR will it hit all time low, Weekly forecast USD INR achieved all target above trend deciding level.Lets analyze USD INR technical for coming 4 days after rupee opened at a record low on Tuesday
USD INR 4 Hour Chart
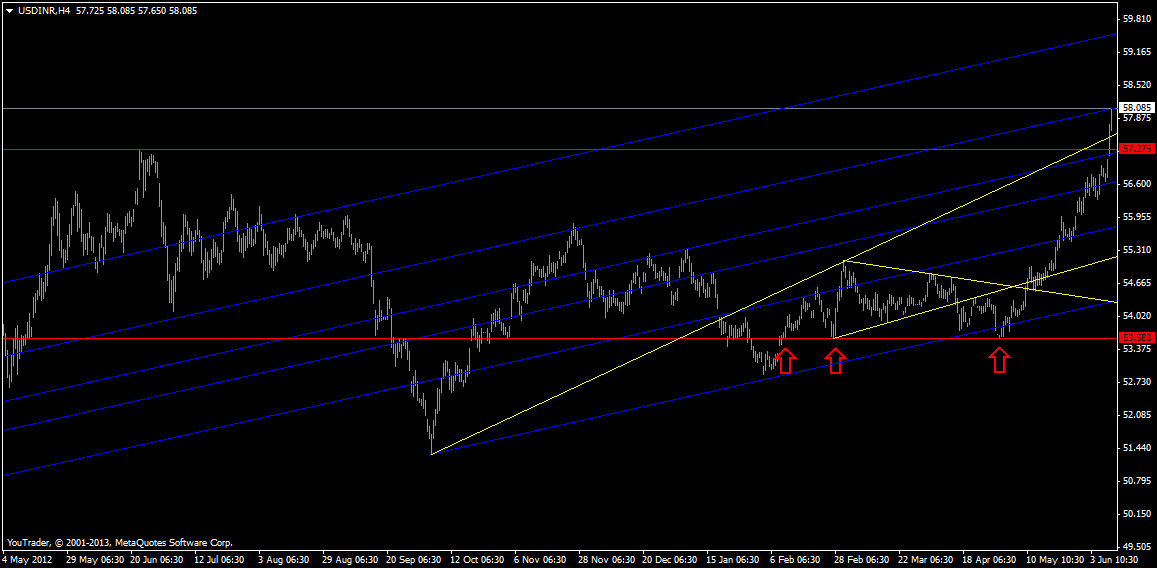
USD INR 4 hour chart is trading at 58.61 which is very important Fibo channel resistance. Unable to cross pullback can be expected in Rupee.
USD INR Daily Chart

As per Daily charts INR has closed above its 200 DMA which is bullish signal. Also it has closed above its symmetrical triangle which again shows a bullish picture. Target for Symmetrical triangle comes at 54.76+(55.84-52.88) =57.72. This is what we discussed last week and target got achieved. Negative divergence has started showing on Daily chart, confirmation will come once USD-INR starts trading below 58.
USD INR Weekly Chart

Weekly charts have broken the perfect symmetrical triangle and achieved the target, Negative divergence has started showing effect and pullback will be seen in next few session.
USD – INR Trend Deciding Level:59.07
USD – INR Resistance:59.51,60, 60.30
USD – INR Support:57.97,57.56 and 56.87
Levels mentioned are USD – INR June Future
Follow on Facebook during Market Hours: http://www.facebook.com/pages/Brameshs-Tech/140117182685863