PNB
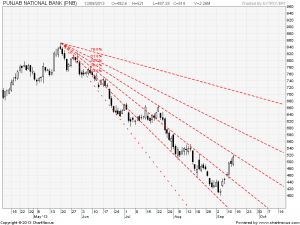
 PNB has been following its fibo fan perfectly. Stock is near very important Gann number of 521. Any close above 521 gives short term target of 555.
Intraday Traders can use the below mentioned levels
Buy above 521 Tgt 527,534 and 540 SL 514
Sell below 512 Tgt 508,500 and 494 SL 514
DLF
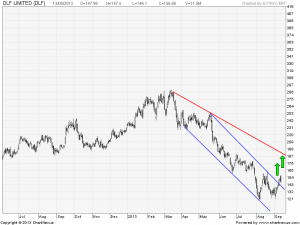
 DLF has broken out of its down trending channel and has traded above it from past 2 trading session as seen in above chart,Positional traders should look for a close above 157 which gives short term target of 165 and 178.
Intraday Traders can use the below mentioned levels
Buy above 158 Tgt 161,165 and 170 SL 156
Sell below 152 Tgt 149.5,147 and 144 SL 154
LT
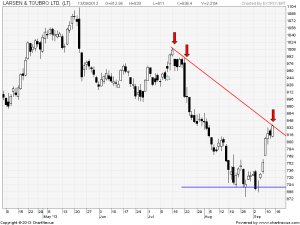
LT has held its support of 677-687 consolidated around the levels and bounced back. Stock has seen a spectacular rally and is now facing resistance at its down ward falling trendline. Positional traders should look for a close above 843 which gives short term target of 898.
Intraday Traders can use the below mentioned levels
Buy above 839 Tgt 846,856 and 865 SL 828
Sell below 827 Tgt 819,811 and 800 SL 836
Stock Performance Sheet for the Month of September is Updated @http://tradingsystemperformance.blogspot.in/ Net Profit for the month of Aug is 1.89 Lakh and Sep Month 88K
Stock Performance Positional sheet for Sep Month is updated on http://positionalcallsperformance.blogspot.com/
- All prices relate to the NSE Spot
- Calls are based on the previous trading day’s price activity.
- The call is valid for the next trading session only unless otherwise mentioned.
- Stop-loss levels are given so that there is a level below/above, which the market will tell us that the call has gone wrong. Stop-loss is an essential risk control mechanism; it should always be there.
- Book, at least, part profits when the prices reach their targets; if you continue to hold on to positions then use trailing stops to lock in your profits.
We do discussion in Live market to update Nifty/Stock levels If you are interested you can LIKE the page to get Real Time Updates.


Good morning Bramesh Sir, Can we buy the stock if it opens gap up, come down and then again go up? For e.g; Yesterday LT opened gap up @ 849 and went till 862 and came down to 825 and then again broke your trigger level of 839 around 1:30 pm and touched almost your target @ 845 Rs and then came down and closed @ 829 Rs.
Dear Ram Sir,
You can do the same but keep qty less.
Rgds,
Bramesh
L&T is showing DLF chart.
Thanks Nikhil!!
Correct chart has been updated
Rgds,
Bramesh