


In Our last analysis, Has Indian Rupee made Short term Top, Weekly Analysis Rupee made the top and started correcting achieved our last target of 64.4. Lets analyze where is Rupee heading in coming week we have crucial event as Fed Tapering and RBI Policy.
USD INR Hourly

USD INR Hourly charts have pulled back from Fibo Channel and heading towards the support of 63. Any break below 63 will lead to further downfall till 61.5 odd levels.
USD INR Daily
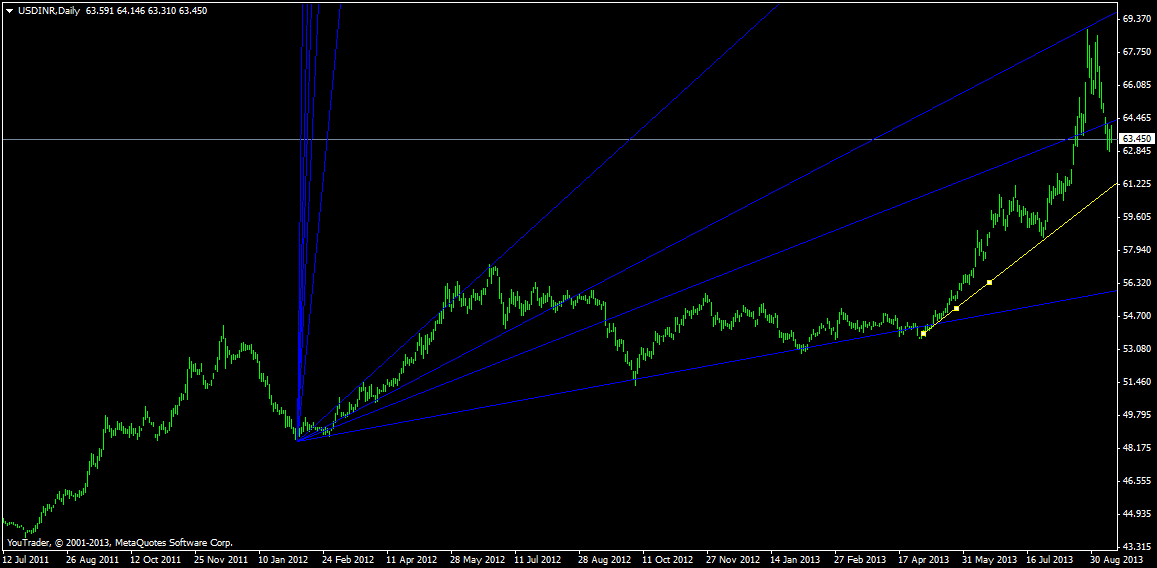
USD INR chart made top as per Gann Fan as discussed in previous post. Now if INR is unable to cross 63.88 its heading towards the daily support of 61.3 as shown by yellow line
USD INR Weekly
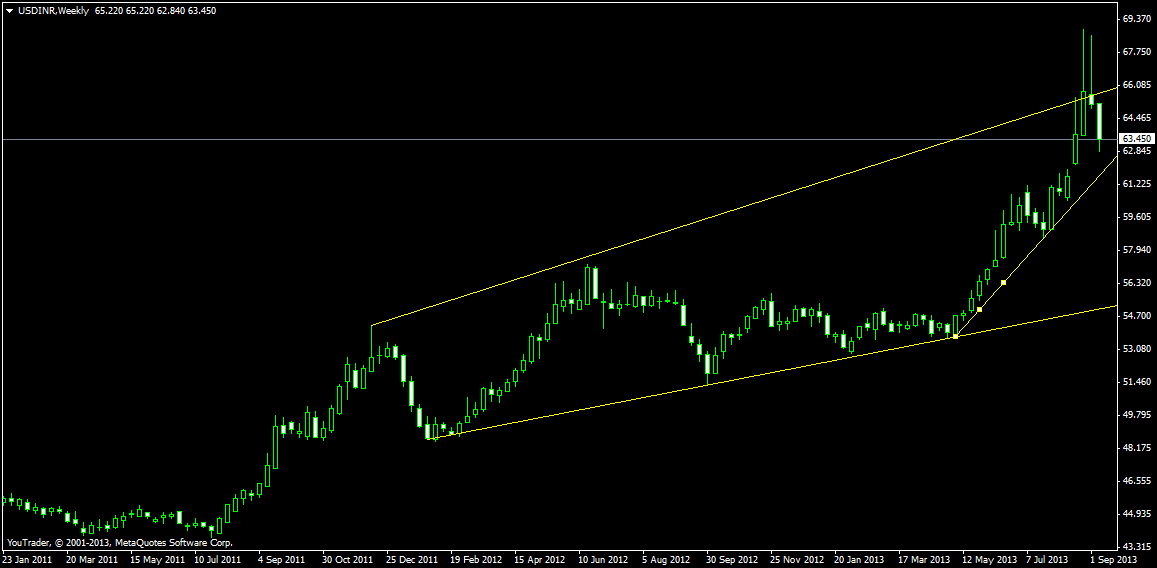
Weekly charts tried moving above the weekly trendline but failed to do for 2 weeks in row.Weekly charts has formed a bearish engulfing pattern weekly support comes at 62.1 the yellow trendline drawn in above chart.
USD – INR Trend Deciding Level:63.88
USD – INR Resistance:64.55,65.50 and 66.10
USD – INR Support:62.75,62.3 and 61.3
Levels mentioned are USD – INR September Future
Follow on Facebook during Market Hours: http://www.facebook.com/pages/Brameshs-Tech/140117182685863