


Last week we gave Trend Deciding level as 5686 Nifty Nifty opened with big gap up and traders were unable to enter longs 🙁 .The government unveils data of inflation based on the wholesale price index (WPI) for August 2013 on Monday, 16 September 2013. WPI inflation is seen accelerating to 5.9% in August 2013 from 5.79% in July 2013, as per the median estimates of a poll of economists.The FOMC holds a two-day policy meeting on Tuesday 17 September and Wednesday 18 September 2013 to decide on Fed Tapering. The Reserve Bank of India will release a Mid-Quarter Review of Monetary Policy 2013-14 at 11:00 IST on Friday, 20 September 2013.
Lets analyze how to trade Nifty next week.
Nifty Hourly Chart

Nifty Hourly charts as shown above is trading in a channel,Unable to close above 5946-64 Nifty can see pullback till 5738 odd levels.
Nifty Gaps
For Nifty traders who follow gap trading there are 3 trade gaps in the range of 5300-6000 and all other gaps got filled.
- 5285-5303
- 5448-5553
- 5680-5738
Nifty Daily Chart
Nifty daily chart has closed above its 200 DMA on weekly basis. On Upside any close above 5964 will break the lower top formation on larger time frame as shown in below chart. Unable to break the same the nifty can correct to lower end of trendline at 5716. September has been Mostly Bullish month for Indian market Sep 2010 Nifty rallied 9% Sep 2011 Nifty was down 1.2% Sep 2012 up by 8% and Sep 2013 till date is up 6.9%.

Fibonacci technique
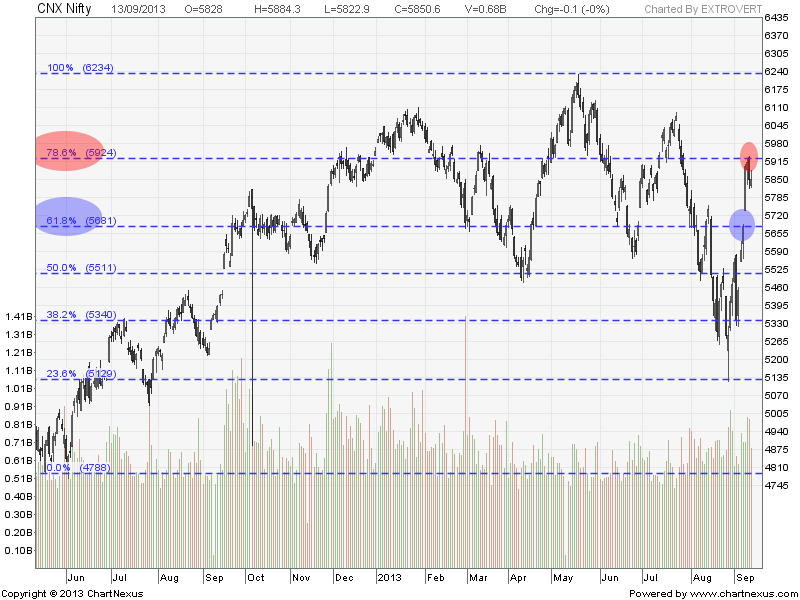
As per of Fibo Retracement theory Nifty has broken the resistance at 61.8% retracement with gap up, and is now facing resistance at the 78.6% retracement.
Fibonacci fan

Nifty Fibonacci fan are wonderful tool to find the top and bottom in short term.The above chart is self explanatory 🙂
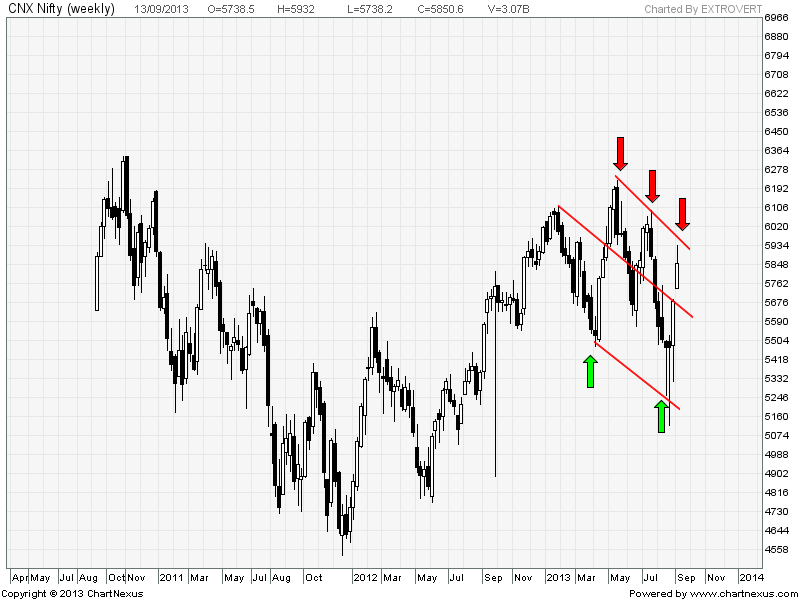
Nifty Weekly Chart
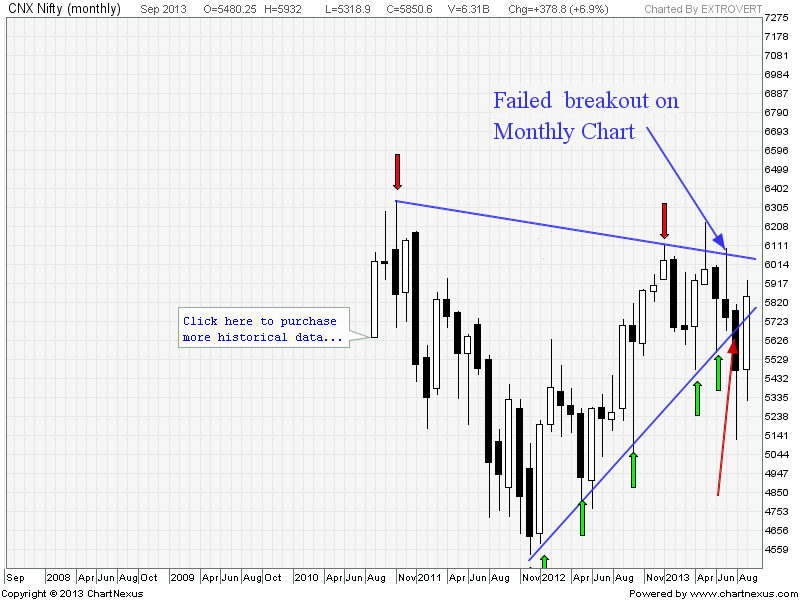
Trading Monthly charts
Nifty Trading Levels
Nifty Trend Deciding Level:5806
Nifty Resistance:5865,5946,5995 and 6077
Nifty Support:5738,5680,5605 and 5563
Levels mentioned are Nifty Spot
Stock Performance Intraday sheet for Sep Month is updated on http://tradingsystemperformance.blogspot.com/
Stock Performance Positional sheet for Sep Month is updated on http://positionalcallsperformance.blogspot.com/
Let me go by Disclaimer these are my personal views and trade taken on these observation should be traded with strict Sl
Want to see post in your Inbox,Register by adding your email id in Post in your Inbox section
Follow on Facebook during Market Hours: https://www.facebook.com/pages/Brameshs-Tech/140117182685863
very gud sir