Technical Analysis of BHEL,Kotak Bank


Nifty Hourly Nifty gave a expected upmove yesterday as per hourly charts.5440 was a level of Support and we saw an expected upmove inspite of weak global cues. Trade on System not on your emotion/Intutuion Now For today Arrow Marks in Red should be intital point of Resistance @5521 move above that should take us… Read More »

Bombay Dyeing Bombay dyeing has been respecting its upward and downward channel as shown in the chart. Break on above the trendline can add further rally to the stock. Mometum indicator are in overbought zone and Rise in stock is accompanied with expansion in volume which is healthy for stock Buy above 375 Tgt 379… Read More »

HDFC LTD HDFC is forming an ascending triangle with lower trendline support @ 659 Levels and Facing upper trendline support@685. HDFC has been in trading range and its going smaller as per ascending triangle formation. Indicators are showing strength but break of trading range is important for any explosive upmove either on downside or upside.… Read More »

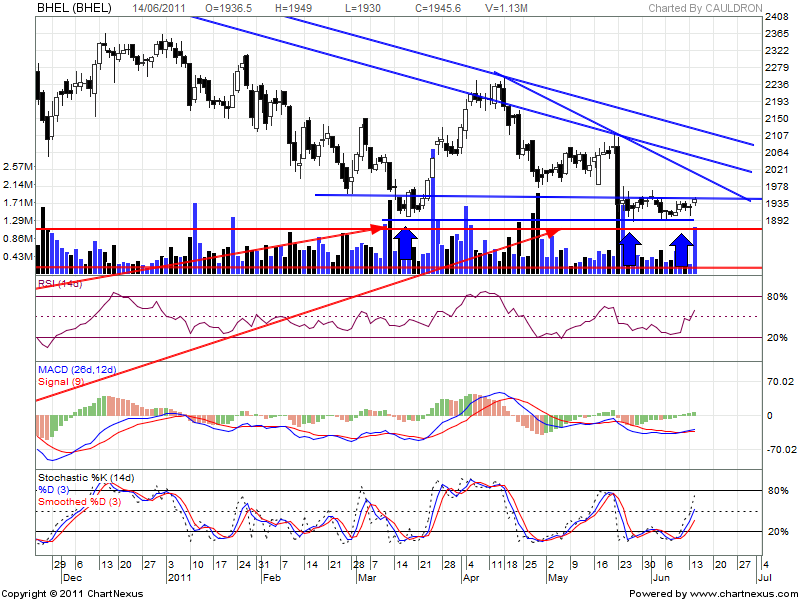
BHEL BHEL has been looking weak on TA charts after its results and split news came.Stock was unable to cover the losses of result day and Slowly drifting down.BHEL has found good support around 1890 levels and have bounce twice from that. Indicators are oversold so if 1890 is held a bounce can be expected… Read More »

Mphasis Mphasis after 27% fall on bad results during the result season has unable to recoup its losses. Technically looking it looks poised for breakout above 485 levels for short term. Indicators are showing short term strength. Buy above 485 Tgt 491,497 and 505 Nifty Hourly Nifty as expected gave a bounce back from… Read More »

Nifty Hourly Chart As seen from Hourly Chart Nifty was unable to cross 5600 which is the swing high before the previous fall. Negative Divergence was observed in RSI but we would require a price confirmation of the same. Nifty was able to cross over 5565 the Fibo resistance which is a booster to Bulls… Read More »

ICICI BANK ICICI bank broke out of its falling wedge pattern which is a bullish pattern. Stock has been taking support around 994 levels and giving decent bounces.Stock is approaching another major resistance of 200 DMA @1084. 200 DMA is defining lines between Bulls and Bears Move above 1084 will make the stock to enter… Read More »

HDFC HDFC has been taking support from its short term rising trendline(drawn in Red) around 635 Levels.Blue Line drawn shows a classic example of support becoming resistance. MACD has generated a Buy and RSI showing postive divergence. Buy above 663 Tgt 669,680 and 690 Sell below 635 Tgt 626,617 and 610 Bharti Airtel… Read More »
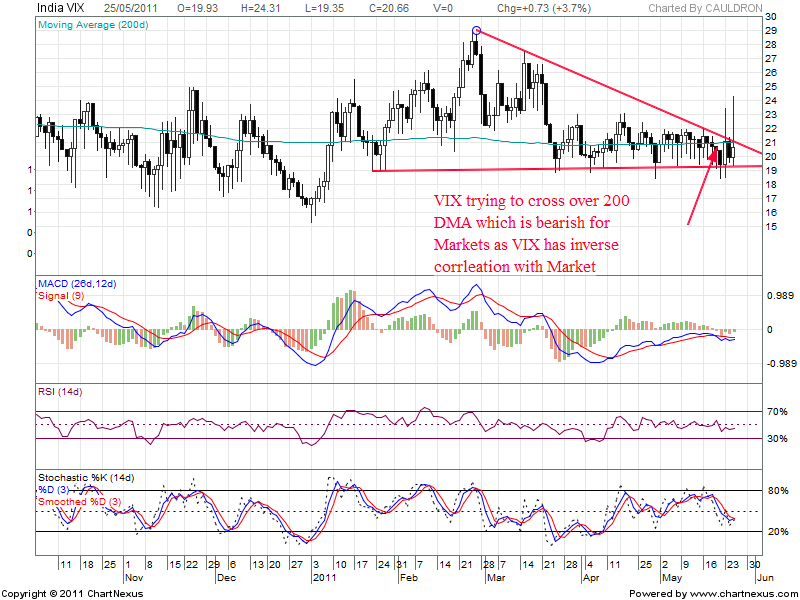
India VIX VIX is the fear factor it and it signifies the the market volatility and prone of falling. VIX has inverse correlation with Nifty.ie. If VIX rises Nifty falls and vice versa. Live VIX CHART(Click on Link to see Live VIX chart) As seen from above chart VIX is trying to cross 200 DMA@21.… Read More »