HDFC LTD
HDFC is forming an ascending triangle with lower trendline support @ 659 Levels and Facing upper trendline support@685.
HDFC has been in trading range and its going smaller as per ascending triangle formation.
Indicators are showing strength but break of trading range is important for any explosive upmove either on downside or upside.
On Downside levels of 640 will provide decent support.
Buy above 674.2 Tgt 683,692
Sell below 658 Tgt 653,646 and 639
LARSEN
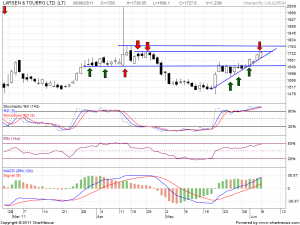
LT has been on good run up after results were out ,Stock moved from 1500 levels to 1750 odd levels. Now come the intresting part.
As seen from the below chart LT has come under zone of resistance@1735 level and volumes are on lower end.
Move with volume is required for stock to move out of this zone of resistance 1735-1766 levels.
As stock is in overbought level based on indicator pullback should be expected
Sell around 1742 Tgt 1720,1699 and 168
NIFTY LEVELS TO FOR TODAY‘s Trading
Buy above 5543 TGT 5566,5581
Sell below 5518 TGt 5494,5479 and 5450
Levels Mentioned are SPOT LEVELS.
STAY DISCIPLINED!!


hi bramesh
Nice Explanation, but don’t you think large white space in symmetrical triangle is a question on its authentication on being a valid triangle ?
Don’t mine I am a learn also. if possible explain.
Hi Jamil Sir,
Yeah thats a point which can be debated. But bottom line we need to follow levels and trade.
Thanks for your comment.
Rgds,
Bramesh
hi bramesh
Nice Explanation, but don’t you think large white space in ascending triangle is a question on its authentication on being a valid triangle ?
Don’t mine I am a learn also. if possible explain.
Dear Mr.Brahmesh,
What HDFC is showing i think is a Symmetrical Triangle. Ascending Triangle is one which makes same highs and higher lows. Here in the chart it is forming higher lows and lower highs signalling symmetrical triangle formation as per theory.
Plz check and confirm, i may be incorrect.
Larsen chart is 100% perfect. Bravo!!!
Thanks Arun Sir for correcting the mistake.
It is a Symmetrical Triangle only.
For Readers reference i am including the definition of Both
What Does Ascending Triangle Mean?
A bullish chart pattern used in technical analysis that is easily recognizable by the distinct shape created by two trendlines. In an ascending triangle, one trendline is drawn horizontally at a level that has historically prevented the price from heading higher, while the second trendline connects a series of increasing troughs. Traders enter into long positions when the price of the asset breaks above the top resistance.
What Does Symmetrical Triangle Mean?
A chart pattern used in technical analysis that is easily recognized by the distinct shape created by two converging trendlines. The pattern is identified by drawing two trendlines that connect a series of sequentially lower peaks and a series of sequentially higher troughs. Both trendlines act as barriers that prevent the price from heading higher or lower, but once the price breaches one of these levels, a sharp movement often follows.
Dear Mr Bramesh
I have been going through your writings over the last few days and find them very interesting.I am new to the the sharemarket as far as actual trading goes but I have done some reading on sharetrading and hope to start actual trading,in fact i have started small with dena bank and Apollo tyres etc.
I was actually planning to buy some L&T today as per at least 2 analyst who have advised to buy around 1680-1700 levels for target 1800.I got my price today but you have advised to sell L&T-hence got a bit confused.Should I wait for your target(1680) to reach before I buy?
From the basic chart at Moneycontrol website I can see that 1680-1700 is a very good support and 1760 is a resistance.
Another question-is there any other way of shortselling apart from in Daytrade and futures?
Regards
Dipankar
Thanks Dipankar for your Kind words. Appreciate the Kind gesture.
Rgding LT 1735-1766 is zone of resistance and a close above it with volumes will give it an upside momentum.LT is buy on dips till it do not close below 1681.