BHEL
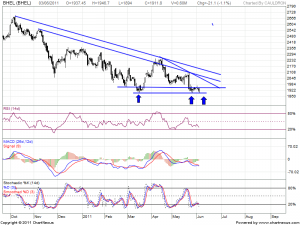
BHEL has been looking weak on TA charts after its results and split news came.Stock was unable to cover the losses of result day and Slowly drifting down.BHEL has found good support around 1890 levels and have bounce twice from that.
Indicators are oversold so if 1890 is held a bounce can be expected and if 1890 breaks than BHEL can continue its downfall and fill the MAY-2009 Gap
GAP FILLING IN BHEL
Can BHEL fill the May 2009 Gap?
 As seen from above chart BHEL1780-1876 is the gap which is unfilled where no Trade occurred and BHEL needs to fill the gap.
if 1890 breaks BHEL can move down and fill the gap which is healthy for stock is long term.
Sell below 1890 TGt 1864,1835,1800 and 1780
Buy above 1917 Tgt 1946,1967 and 1993
AMBUJA CEMENT
Trend line convergence in Ambuja Cement and 50SMA@143.4 is a tough resistance to move up.
Sell below 141.8 Tgt 140.5 and 138.5


