


Executive Summary: Bears Tighten Grip at Crucial Junction
Bank Nifty Futures witnessed aggressive selling pressure on September 15, plunging 789 points in a wide 1,099-point trading range to settle at 55,794. The sell-off was accompanied by institutional short additions, heavily skewed negative market breadth, and prices breaking well below critical rollover thresholds.
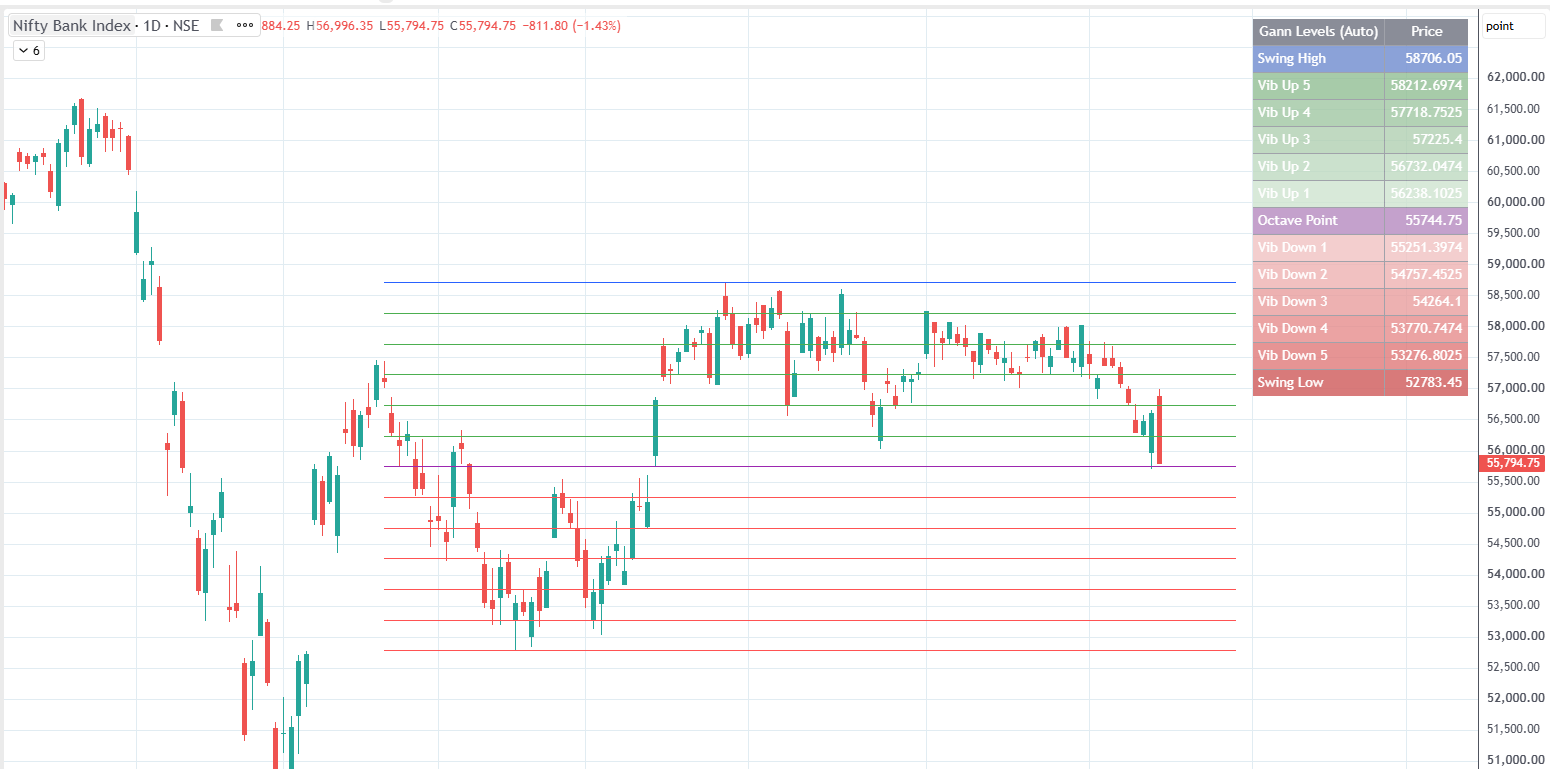
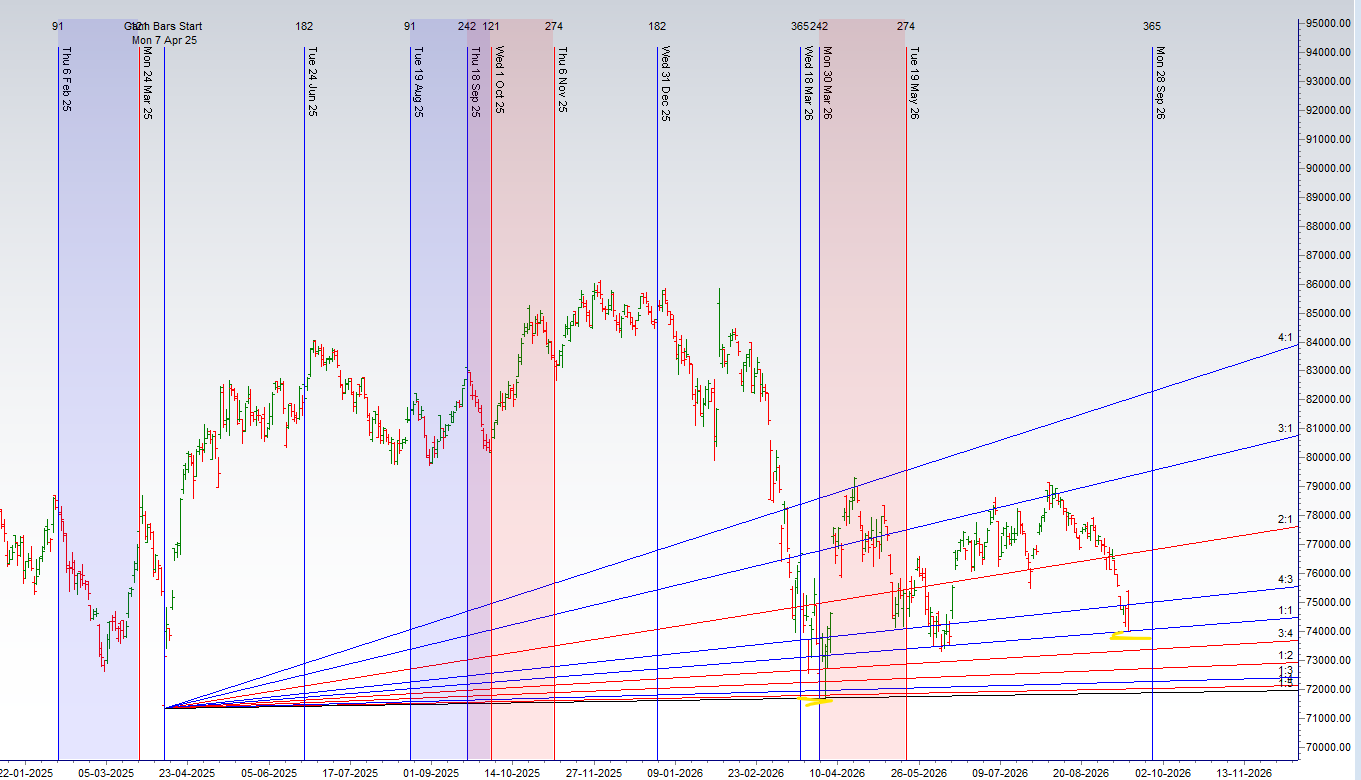
Ahead of the impending U.S. Federal Reserve policy announcement, the index has arrived at a structural crossroad: testing its Octave Point and the critical 1×1 Gann support angle. The current setup presents a classic make-or-break zone where holding above support can trigger an aggressive short-covering bounce, while a breakdown threatens extended multi-hundred-point downside.
1. Derivative & Institutional Data Breakdown
Institutional positioning and derivatives architecture point to persistent supply overhead:
-
FII Position Flow: Foreign Institutional Investors (FIIs) remained decisively bearish in Bank Nifty Index Futures, offloading 2,700 contracts valued at ₹457 crore. This reduced net Open Interest (OI) by 3,378 contracts, pointing to active short-selling alongside the liquidation of long positions.
-
Futures OI & Cost of Carry: September Futures total OI climbed to 21.9 lakh contracts, reflecting an addition of 0.34 lakh contracts. A simultaneous increase in the Cost of Carry alongside price declines confirms the fresh accumulation of short inventory.
-
Rollover Benchmark: The index closed significantly below its Rollover Cost of 57,901, placing prevailing monthly long positions deeply out-of-the-money and cementing overhead resistance.
-
Market Breadth: The Advance-Decline ratio collapsed to 1:13, underscoring broad-based institutional selling across banking constituents rather than an isolated heavyweight drag.
Key Options Metrics
-
Current Market Price (CMP): 55,794
-
Put-Call Ratio (PCR): 0.78 (Approaching oversold territory; potential fuel for short-covering rallies if key supports hold)
-
Max Pain: 57,100 (Significant divergence from CMP)
-
Major Call Resistance (Ceiling): 56,500 (Highest Call OI concentration)
-
Major Put Support (Floor): 55,000 (Highest Put OI concentration)
2. Gann Angles & Structural Octave Levels
The index is interacting directly with high-consequence mathematical levels:
-
The Gann 1×1 Angle & Octave Point: Bank Nifty is halting directly at its Octave Pivot, aligning with the 1×1 Gann support ray at 55,744.
-
Bullish Rebound Pathway: If buyers defend 55,744, expect an initial mean-reversion counter-rally toward 56,238, with an extended target at 56,732.
-
Bearish Breakdown Pathway: A decisive close or sustained trade below 55,700 breaks the Gann 1×1 structure, clearing the path for an accelerated slide toward 55,251, followed by 54,757.
3. Critical Trend Change Pivots
To trade in sync with institutional flows, track these two pivotal markers:
| Horizon | Level | Institutional Significance |
| Positional Trend Change | 56,536 | Sustained trade above shifts the multi-day framework to bullish. Trading below maintains short dominance. |
| Intraday Trend Change | 56,426 | Serves as the line in the sand for day traders; intraday strength remains capped below this mark. |
4. Intraday Trading Plan
Directional Triggers & Price Targets
                    [ Bullish Zone: Sustains > 56,100 ]
             Target 1: 56,225  |  Target 2: 56,436  |  Target 3: 56,666
                                    ▲
                                    │
                                 [ 55,794 CMP ]
                                    │
                                    ▼
                    [ Bearish Zone: Breaks < 55,950 ]
             Target 1: 55,800  |  Target 2: 55,666  |  Target 3: 55,444
-
Long Setup (Strength Trigger):
-
Entry Trigger: If Bank Nifty sustains above 56,100 on a 15-minute candle.
-
Upside Targets: 56,225 → 56,436 → 56,666
-
Invalidation / Stop-Loss: Below 55,950
-
-
Short Setup (Weakness Trigger):
-
Entry Trigger: Rejection from intraday resistance or a clear break below 55,950.
-
Downside Targets: 55,800 → 55,666 → 55,444 (with extended potential toward 55,251 / 55,000 if 55,700 cracks).
-
Invalidation / Stop-Loss: Above 56,100
-
5. High-Probability Intraday Time Cycles
Time analysis indicates high likelihood for intraday trend exhausts, volatility spikes, or price pivots around the following time stamps:
-
09:58 AM (Opening range price discovery completion)
-
10:57 AM (Morning session directional trend turn)
-
01:26 PM (European session crossover momentum)
-
02:52 PM (Pre-close expiry/institutional positioning unwinding)
Execution Rule: When price reaches one of the defined support or resistance pivot zones (56,100, 55,950, or 55,700) within ±5 minutes of these reversal windows, watch for candlestick rejection patterns (hammer, shooting star, or engulfing) to execute with a tight risk-to-reward ratio.
Summary Action Plan for Traders
-
Watch the Opening Reaction at 55,744–55,700: Avoid aggressive short entries at the open due to the low PCR (0.78), which leaves the market vulnerable to sharp intraday squeezes.
-
Trade the Confirmations: Wait for an explicit breakout above 56,100 for long trades or a failure below 55,950 for short continuation.
-
Respect Positional Caps: Keep institutional shorts in mind; unless 56,426 / 56,536 is reclaimed on a closing basis, any rally should be treated as a tactical pullback rather than a structural reversal.