


The Psychology of the “Time Correction”
In the world of equity markets and technical analysis, traders and investors are conditioned to fear the “price correction”—a sudden, violent drop in index values that wipes out portfolios in a matter of weeks. However, there is another type of market phase that is far more destructive to the psychology of the average market participant: the “time correction.”
A time correction occurs when a market neither crashes nor rallies. Instead, it enters a prolonged period of sideways consolidation, trapping capital and frustrating trend-followers. For 24 months, the market simply chops around in a broad range, destroying options premiums through theta decay and testing the patience of even the most disciplined investors.
During these agonizingly flat periods, retail participants often capitulate, assuming the market has lost its structural momentum. They abandon their core strategies, liquidate their holdings, and miss the impending explosion in price. But what if a flat two-year market is not a sign of weakness, but rather a coiled spring preparing for a massive expansion?
Recent data analysis extracts a powerful historical precedent: historically, flat two-year Nifty performance has often been followed by stronger one-year and three-year returns.
The Nifty Recovery Pattern: A Data-Driven Perspective
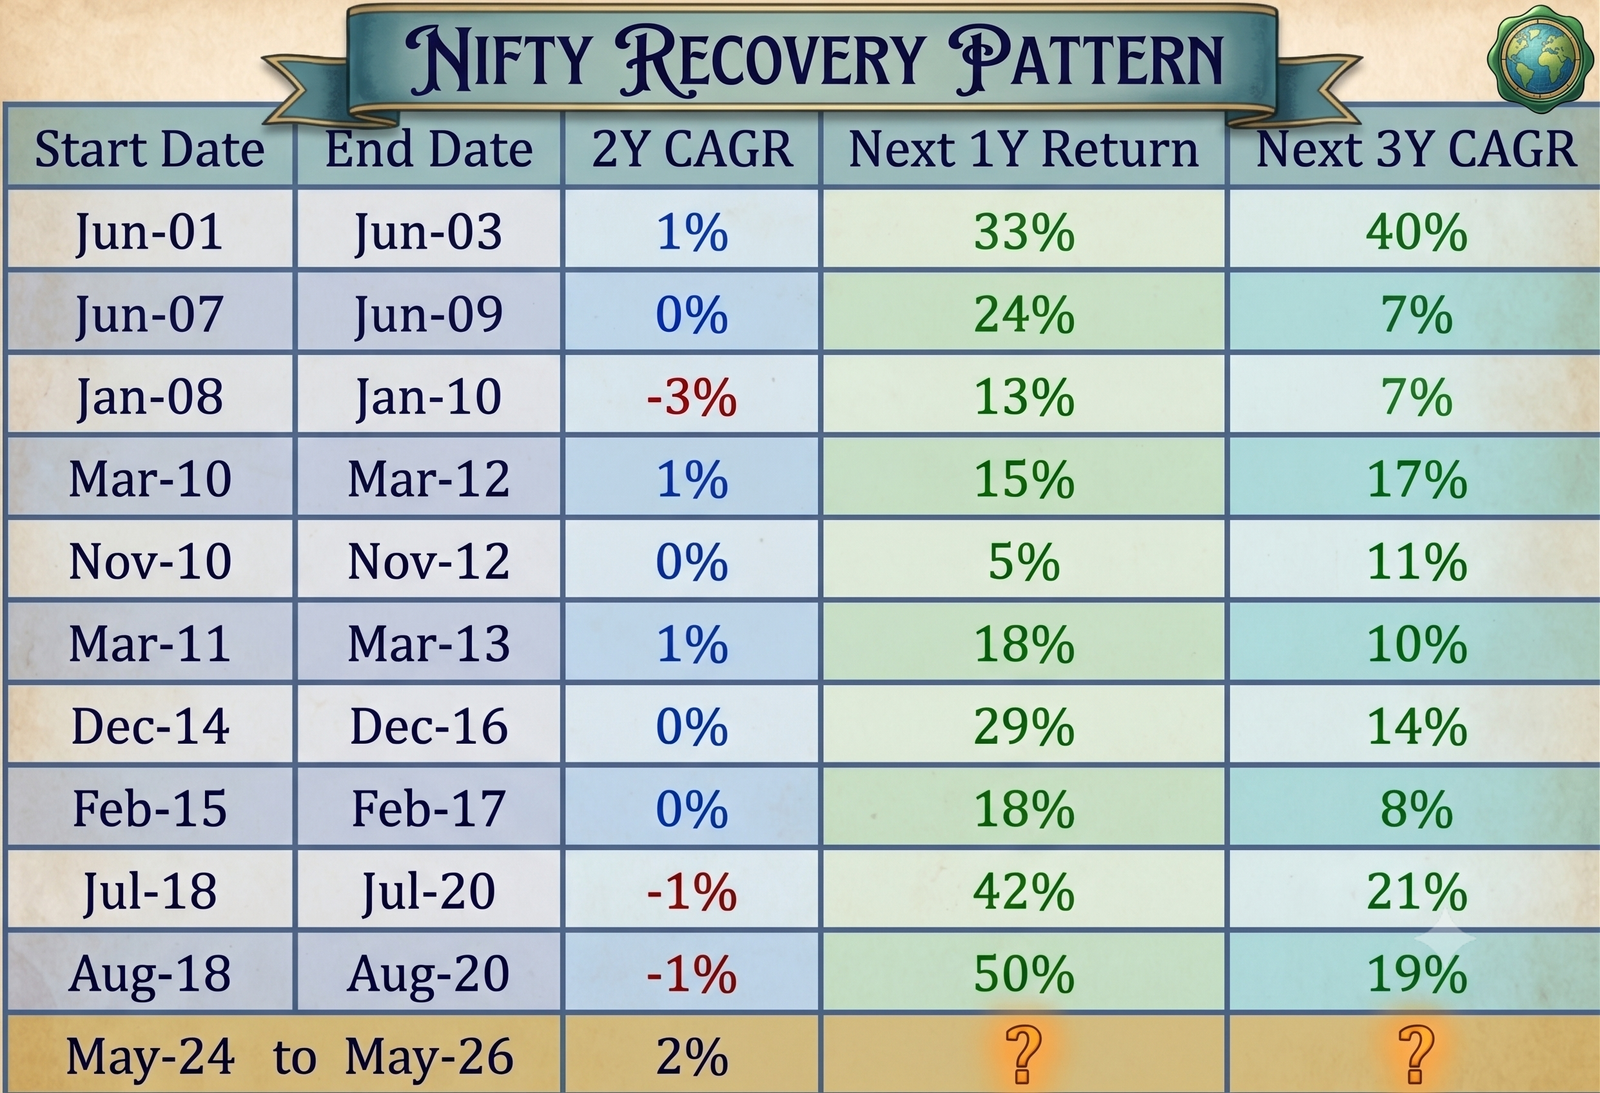
The data isolates multiple historical periods where the Nifty’s two-year Compound Annual Growth Rate (CAGR) flatlined near zero, and tracks the explosive market performance that immediately followed.
To understand the mechanics of this recovery, we must first look at the pure mathematics governing these cycles. The Compound Annual Growth Rate is defined by the following standard equation:
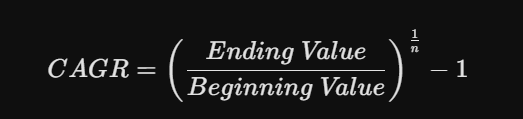
When n = 2$ (representing a two-year holding period), a CAGR of 0% to 2% indicates that the Ending Value is virtually identical to the Beginning Value. Over these 24 months, corporate earnings typically continue to grow, which naturally compresses Price-to-Earnings (P/E) multiples. The index becomes fundamentally cheaper without the price ever having to drop. This creates a massive valuation divergence, acting as rocket fuel for the next directional trend.
The historical data provided by Edelweiss Mutual Fund paints a crystal-clear picture of this exact phenomenon playing out across different market cycles.
The Historical Evidence
Let us break down the specific periods where the Nifty tested investor patience, only to reward those who held through the time correction.
The Early 2000s and the Global Financial Crisis Setup
The early 2000s were marked by the aftermath of the dot-com bubble.
-
Between June 2001 and June 2003, the Nifty posted a mere 2-year CAGR of 1%.
-
However, this flatline preceded a spectacular next 1-year return of 33%.
-
The momentum sustained, delivering a massive next 3-year CAGR of 40%.
As the market built toward the 2008 Global Financial Crisis (GFC), we saw another stall.
-
For the period from June 2007 to June 2009, the 2-year CAGR fell to exactly 0%.
-
The market subsequently snapped back with a next 1-year return of 24%.
-
The next 3-year CAGR for this period stabilized at 7%.
The depths of the GFC caused another severe distortion.
-
From January 2008 to January 2010, the Nifty actually experienced a negative 2-year CAGR of -3%.
-
Yet, the recovery pattern held true, yielding a next 1-year return of 13%.
-
The subsequent 3-year CAGR for this period was 7%.
The Choppy Consolidation of the 2010s
The years following the GFC recovery were characterized by intense global macroeconomic uncertainty, leading to multiple back-to-back time corrections in the Indian market.
-
From September 2009 to September 2011, the 2-year CAGR was a sluggish 1%.
-
This was followed by a solid next 1-year return of 15%.
-
The next 3-year CAGR for this timeframe accelerated to 17%.
-
Shortly after, between March 2010 and March 2012, the 2-year CAGR dropped back to 0%.
-
The next 1-year return was a modest 7%.
-
However, the longer-term structural trend prevailed, delivering a next 3-year CAGR of 17%.
-
The period from November 2010 to November 2012 also saw a 2-year CAGR of 0%.
-
This led into a next 1-year return of 5%.
-
The subsequent 3-year CAGR for this phase was 11%.
-
From March 2011 to March 2013, the index managed a meager 2-year CAGR of 1%.
-
The recovery brought a strong next 1-year return of 18%.
-
The next 3-year CAGR for this cycle was 10%.
As the mid-2010s approached, the market again entered a phase of sideways digestion.
-
Between December 2014 and December 2016, the Nifty registered a 2-year CAGR of 0%.
-
The breakout from this zone resulted in a powerful next 1-year return of 29%.
-
The next 3-year CAGR for this period was a healthy 14%.
-
Similarly, from February 2015 to February 2017, the 2-year CAGR was 0%.
-
The subsequent next 1-year return was 18%.
-
The next 3-year CAGR for this block was 8%.
The Pre-COVID Stagnation and Subsequent Explosion
Perhaps the most dramatic examples of the coiled spring effect occurred just before the COVID-19 pandemic reshaped global finance.
-
From July 2018 to July 2020, the Nifty suffered a negative 2-year CAGR of -1%.
-
As the time correction ended, the index erupted with a next 1-year return of 42%.
-
The momentum carried forward into a massive next 3-year CAGR of 21%.
-
Looking at a slightly shifted window from August 2018 to August 2020, the 2-year CAGR was again -1%.
-
This period preceded an even more aggressive next 1-year return of 50%.
-
The next 3-year CAGR for this timeframe remained exceptional at 19%.
The Current Market Conundrum: May 2024 to May 2026
This brings us to the most critical data point in the study—the present day.
According to the newspaper extraction, the period from May 2024 to May 2026 is currently tracking a 2-year CAGR of just 2%.
The chart leaves the most pressing questions unanswered:
-
Next 1-year return: ?
-
Next 3-year CAGR: ?
While the future can never be predicted with absolute certainty, the historical weight of the Edelweiss Mutual Fund data is profound. In every single recorded instance where the Nifty experienced a two-year CAGR between -3% and 1%, the subsequent one-year and three-year returns were overwhelmingly positive, often triggering aggressive, multi-year bull markets.
A 2% CAGR over two years indicates that the Indian equity market has been engaging in a deep structural time correction. Prices have largely consolidated, allowing corporate earnings growth to catch up to index valuations. The froth has been removed not through a violent crash, but through the slow, methodical grind of time.
For the professional trader and the long-term investor, this is not a time for pessimism. Market participants who misinterpret this sideways price action as a permanent top are ignoring decades of empirical evidence. They risk abandoning their positions just as the algorithmic models and institutional smart money are finishing their accumulation phases.
Strategic Adjustments for the Coming Cycle
How should an active market participant handle this structural setup?
-
Shift from Range-Bound to Trend-Following: During a 24-month flatline, mean-reversion strategies and non-directional option selling (like Iron Condors or Short Straddles) yield the highest consistency. However, as the time correction matures, traders must prepare to aggressively shift gears. Breakout strategies, trailing stop-losses, and directional long positions become paramount as the coiled spring finally snaps.
-
Respect the Mathematical Base: When a market bases for two years, the eventual breakout is rarely a false signal. The longer the base, the higher in space the market travels. Ensure that any protective stops are given enough breathing room to avoid getting chopped out by residual volatility just before the primary trend resumes.
-
Monitor Sector Rotation: A flat index often masks vicious churning beneath the surface. While the broader Nifty may show a 2% return, specific high-beta sectors may have quietly completed deep price corrections and are already initiating new cyclical uptrends.
Conclusion: The Reward of Patience
The stock market is essentially a mechanism that transfers wealth from the impatient to the patient. The historical data cited by Edelweiss Mutual Fund serves as a stark reminder of this reality.
When the Nifty undergoes a two-year period of zero or negligible returns, it is not dying—it is resting. It is resetting the mathematical and psychological baseline required for the next leap forward. As we look ahead from the May 2024 to May 2026 consolidation window, history strongly suggests that the question marks currently hovering over the next one-year and three-year returns will soon be replaced by substantial, positive figures.
Do not let the time correction shake you out of the ultimate price expansion.