


Disclaimer
This analysis represents the highest-probability forecast derived from expert, multi-decade historical evaluation of astrological signatures and their documented correlation with market psychology and price action.
No Guarantee
This is not a guarantee of future market performance. Financial markets are influenced by numerous dynamic and unpredictable real-world factors. All trading and investment activities carry significant risk, including the potential loss of principal.
Educational Purpose Only
This content is strictly for informational and educational purposes and should not be construed as financial advice or a recommendation to buy, sell, or trade any financial instrument.
Consult a Professional
We strongly advise you to consult a qualified financial advisor before making any investment decisions. Any actions you take based on this analysis are solely your responsibility. We assume no liability for any financial profits or losses that may occur.
Theme for Nifty: The Illusion Test and The Friday Acceleration
- Act I (Start of Week – Mon/Tue): The Engineered Pullback and The Shakeout.The Nifty enters the week in a strong structural position, but the astrological schedule demands a rigorous test. Monday’s Sun Square Saturn, converging with a Nifty Gann Date, is a premier signature for restriction and profit-taking. The price action will be a methodical pullback. Sellers will test the resolve of the bulls. Tuesday is the danger zone. The Neptune Stationensures that the bottoming process will be highly deceptive. Bears will attempt to trigger stop-losses below obvious support levels to create a panic. Bullish and Bearish Scenarios: The critical action is defining the “line in the sand” (the structural support at 24100-24,024). IF the Nifty experiences a sharp “fake-out” breakdown on Tuesday but decisively reclaims and defends this structural support zone on a closing basis, THEN it validates the “buy on dips” thesis, proving the Neptune move was a trap, and establishes a firm foundation for the next leg up.
For a Detailed Day by Day Forecast with Neural Analysis Please watch the below video
Nifty Harmonic Pattern
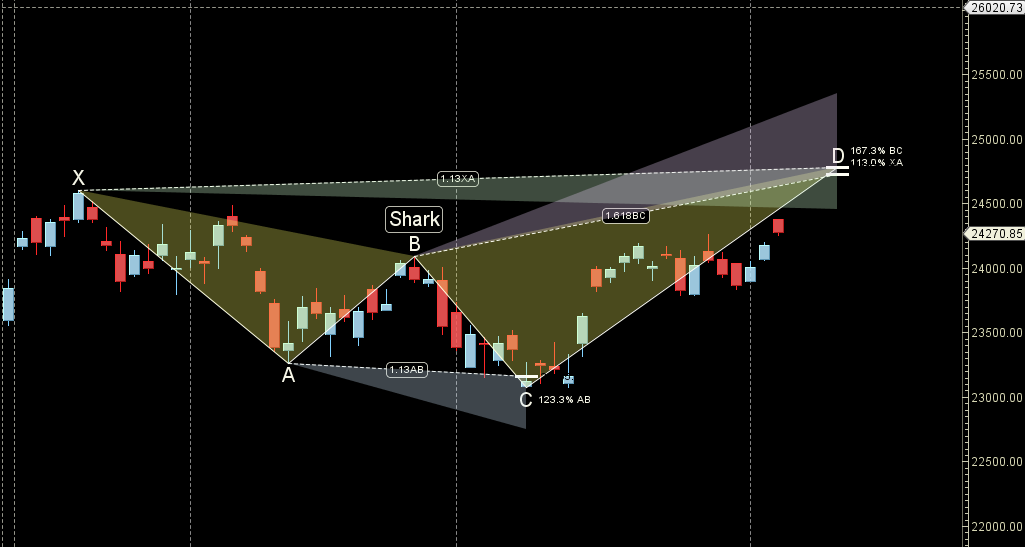
Price holding 24000 can see rally towards 24389/24525
Nifty Gann Angles
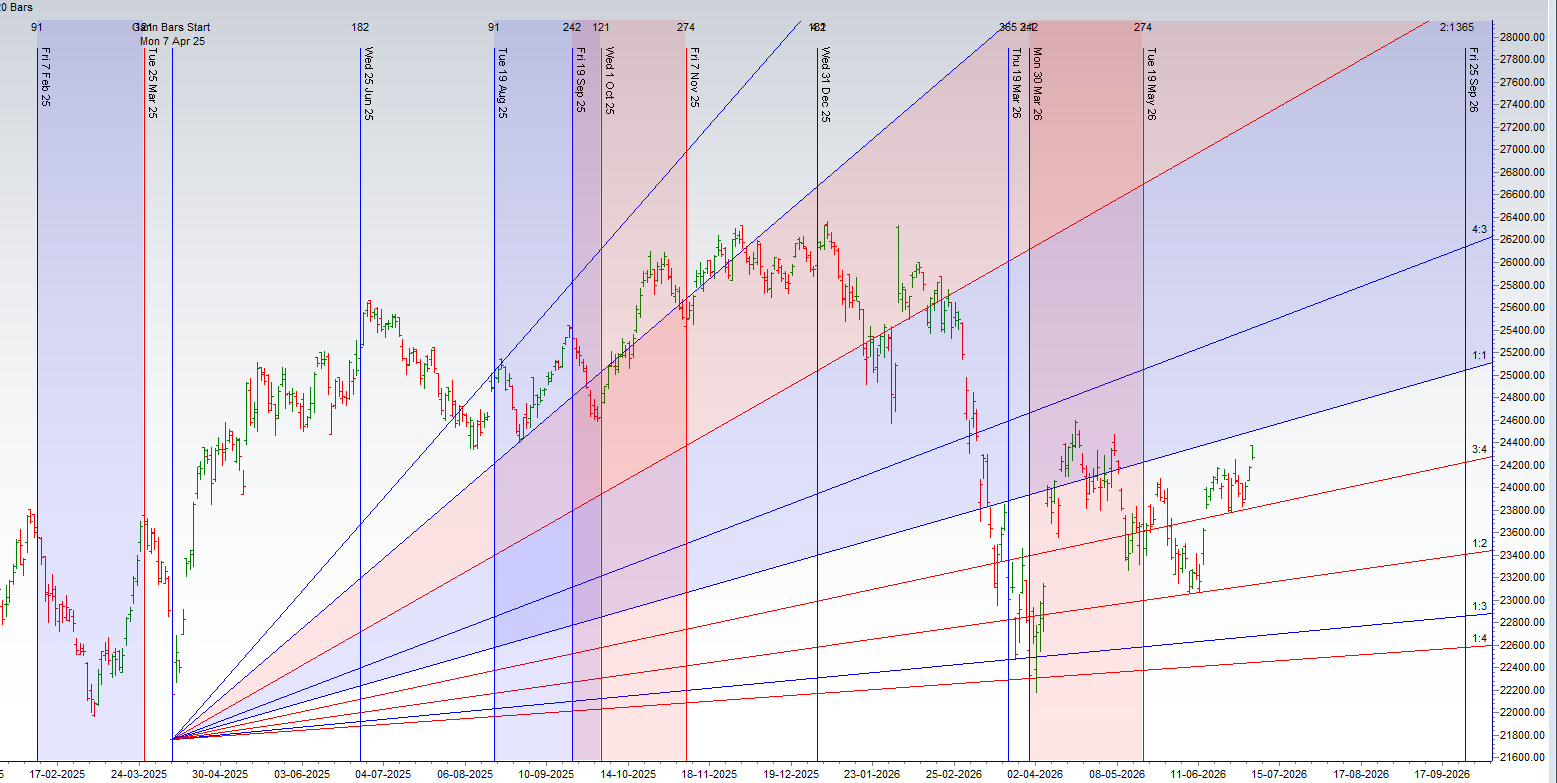
Price is heading towards its 1×1 gann angle zone.
Nifty Supply and Demand
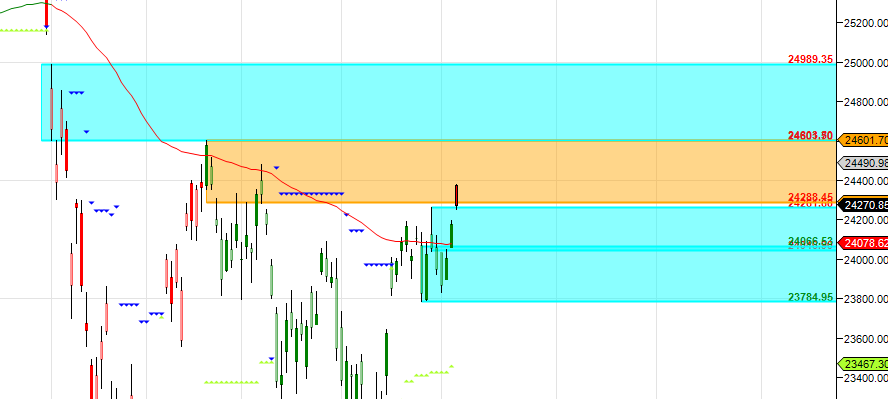
Self Explanatory Chart
Nifty Time Analysis Pressure Dates
Key Pivot Dates: Watch 07/10 July
Nifty Weekly Chart
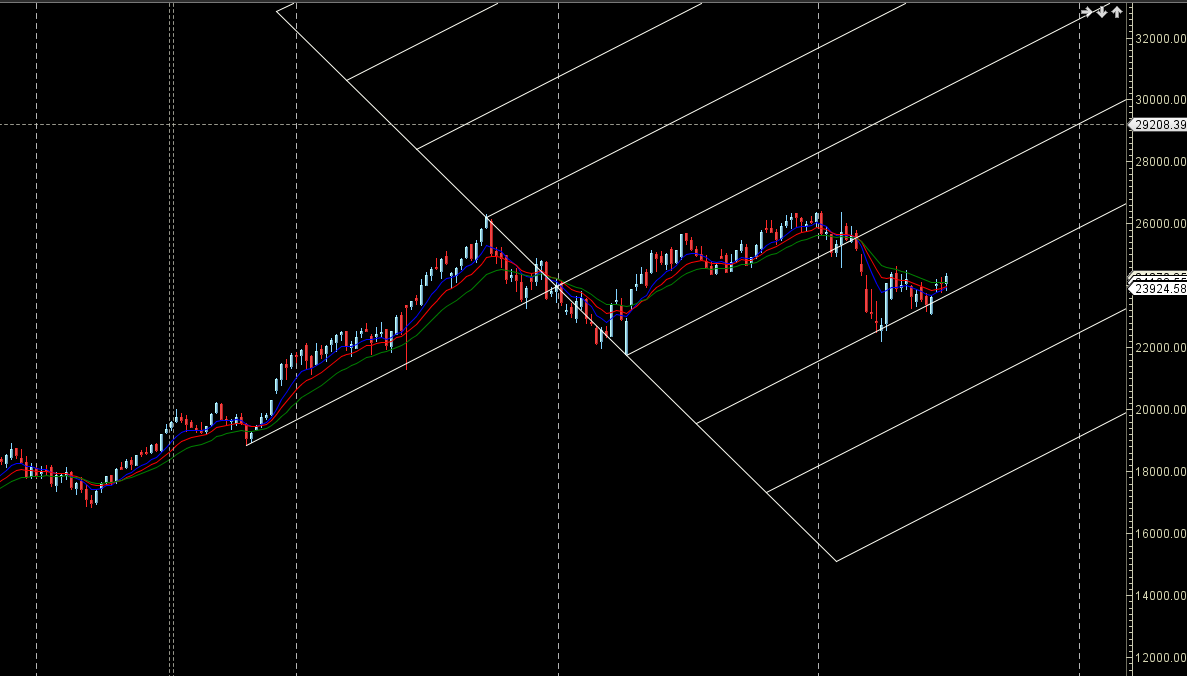
Nifty has closed above MA on Weekly
Nifty Monthly
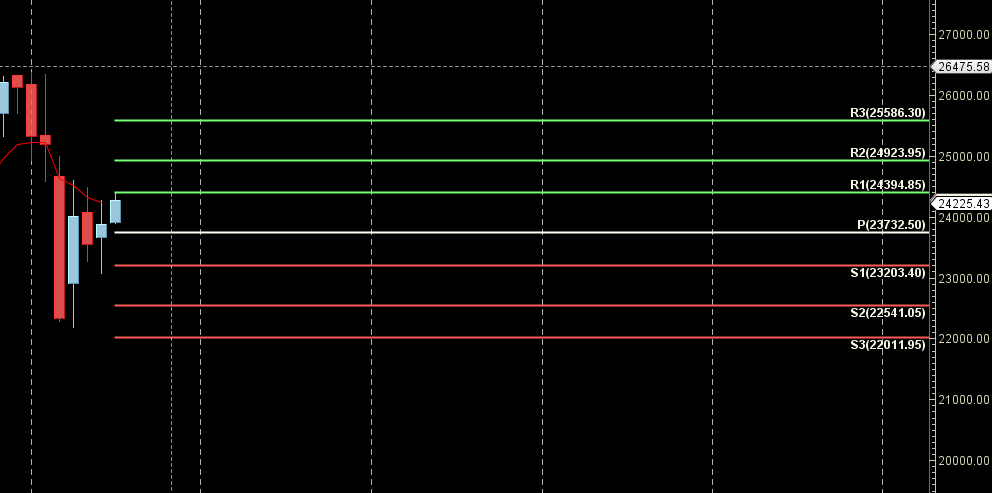
24394 is Monthly resistance zone 23732 is Monthly Support zone.
Nifty Weekly Levels
Nifty Trend Deciding Level: 24252
Nifty Resistance: 24329 24406 24484 24555 24610
Nifty Support: 24174 24097 24020 23943 23866
Levels mentioned are Nifty Spot
As always I wish you maximum health and trading success
Learn More:
W.D. Gann Trading Strategies – Learn how to decode markets using price, time, and geometry.
Trading Using Financial Astrology – Discover how planetary motion impacts market behavior and how to trade it effectively.
Ready to Trade Like a Time-Master?
Join our one-on-one mentorship to master astro-timing, Gann analysis, and institutional-grade setups.
Call: 09985711341
Email: bhandaribrahmesh@gmail.com