


Disclaimer
This analysis represents the highest-probability forecast derived from expert, multi-decade historical evaluation of astrological signatures and their documented correlation with market psychology and price action.
No Guarantee
This is not a guarantee of future market performance. Financial markets are influenced by numerous dynamic and unpredictable real-world factors. All trading and investment activities carry significant risk, including the potential loss of principal.
Educational Purpose Only
This content is strictly for informational and educational purposes and should not be construed as financial advice or a recommendation to buy, sell, or trade any financial instrument.
Consult a Professional
We strongly advise you to consult a qualified financial advisor before making any investment decisions. Any actions you take based on this analysis are solely your responsibility. We assume no liability for any financial profits or losses that may occur.
Theme: The Blue-Chip Rotation and The Jupiter Shift
-
Act I (Start of Week – Mon/Tue): The Chaotic Rebalancing. The Sensex faces a week of intense internal conflict. Monday’s Mercury Retrograde and Equatorial Farthest South aspects guarantee a heavy, confusing tape. Institutional algorithms will misfire, creating deceptive price action. The true driver is Tuesday’s monumental ingress of Jupiter into Leo. This signifies a massive, macro-level rotation of institutional capital among heavyweight sectors. The Full Moon will amplify the emotional intensity of this rotation. The Sensex will experience extreme, divergent volatility—some blue chips will surge while others collapse. The index must establish a definitive structural boundary (a high or a low) during this chaotic rebalancing phase.
For a Detailed Day by Day Forecast with Neural Analysis Please watch the below video
SENSEX Harmonic Pattern
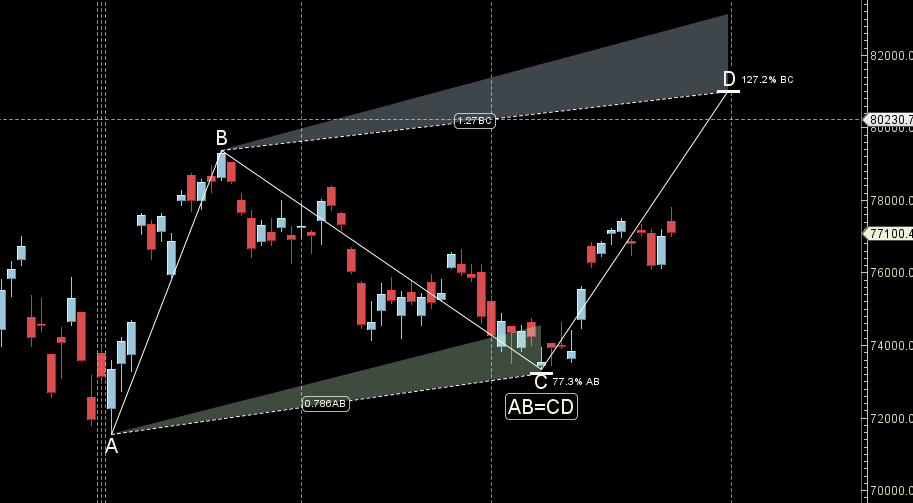
Till 76000 is held we can see upmove till 78000/78500
SENSEX Gann Angles
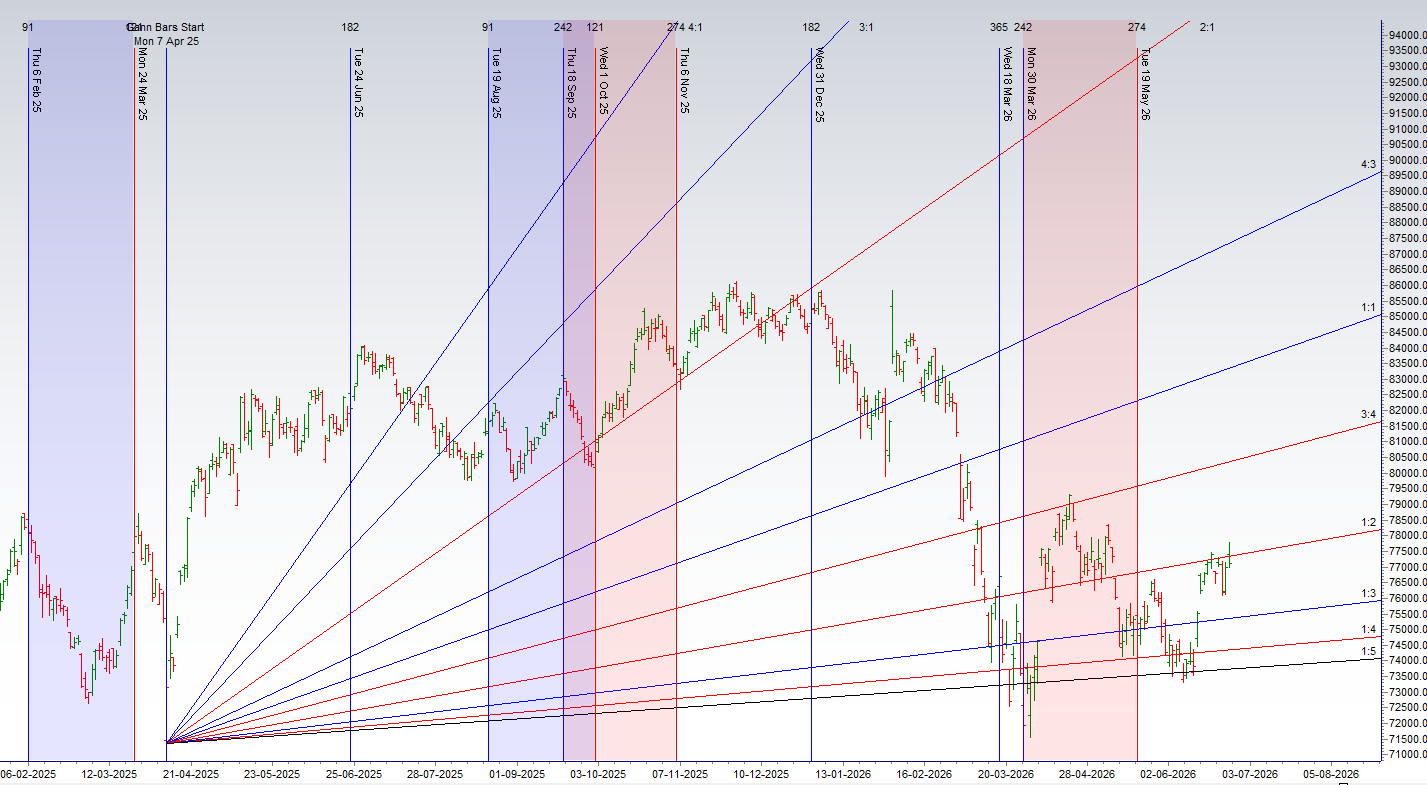
Sensex is heading back to its 1×2 gann angle zone
SENSEX Supply and Demand
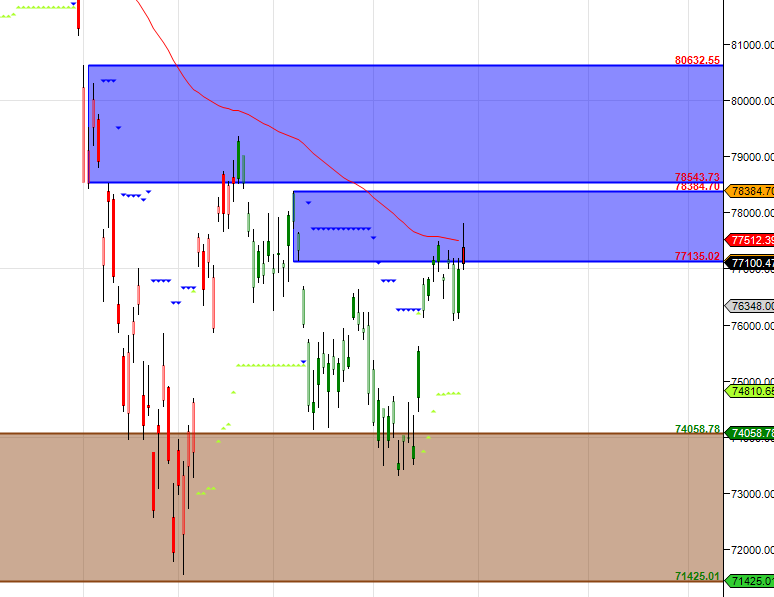
Self Explanatory Chart
SENSEX Time Analysis Pressure Dates
Key Pivot Dates: Watch 02 July
SENSEX Weekly Chart
Sensex formed DOJI on Weekly
SENSEX Monthly Charts
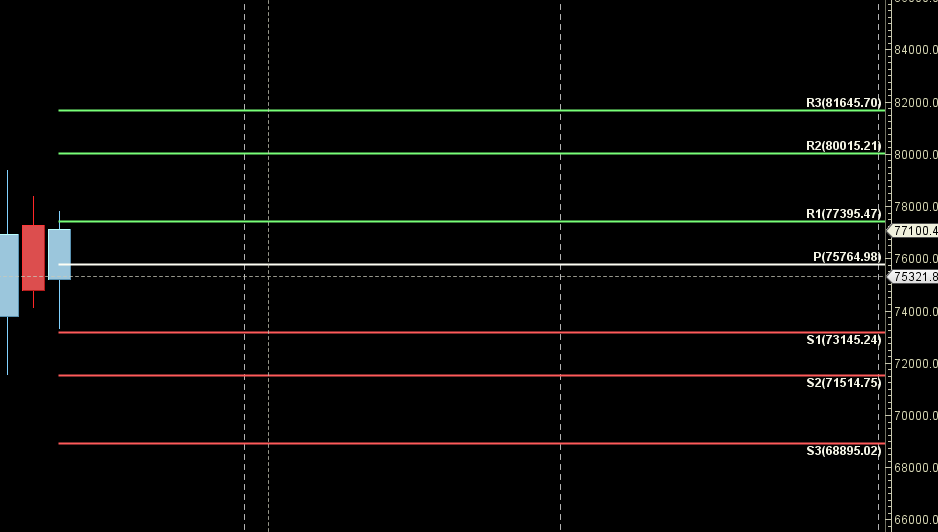
77395 is Monthly resistance zone 75764 is Support zone.
SENSEX Weekly Levels
SENSEX Trend Deciding Level: 76968
SENSEX Resistance: 77244 77520 77796 78072 78347
SENSEX Support: 76968 76692 76416 76140 75800
Levels mentioned are SENSEX Spot
Learn More:
W.D. Gann Trading Strategies – Learn how to decode markets using price, time, and geometry.
Trading Using Financial Astrology – Discover how planetary motion impacts market behavior and how to trade it effectively.
Ready to Trade Like a Time-Master?
Join our one-on-one mentorship to master astro-timing, Gann analysis, and institutional-grade setups.
Call: 09985711341
Email: bhandaribrahmesh@gmail.com