


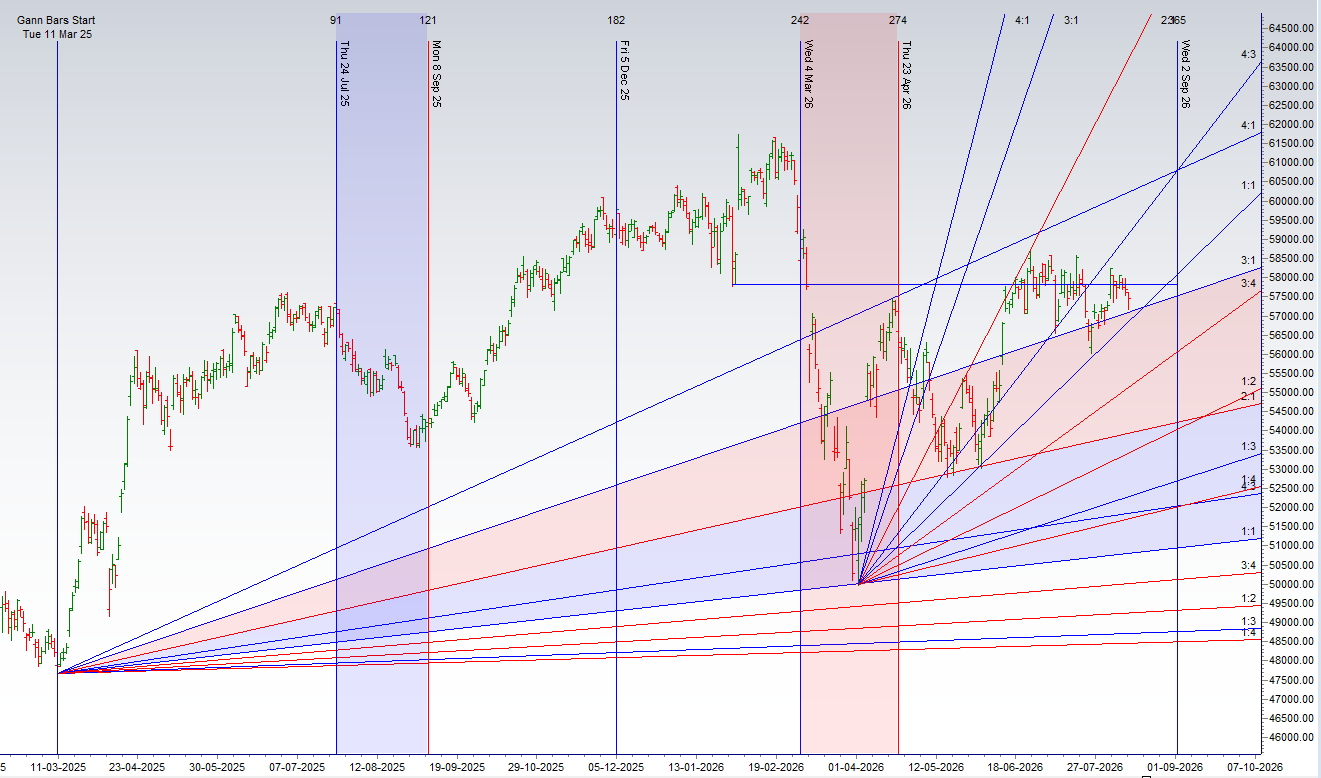
Bank Nifty witnessed a correction in the last trading session, closing down by 296 points with an intraday range of 427 points. Interestingly, the low of 57,158 landed exactly at a critical Gann angle.
Today marks a Total Solar Eclipse, which is a highly significant Astro Date. Traders must mark today’s high and low, as these levels will act as a structural reset and dictate the broader market trend for this entire quarter.
Here is the complete data analysis and trade setup for Bank Nifty to help you plan your trades.
FII Activity & Derivatives Data
Foreign Institutional Investors (FIIs) maintained their Bearish stance in the Bank Nifty Index Futures on 11 Aug 2026.
-
FII Futures Activity: Sold 1,013 contracts worth ₹175 crore.
-
Net Open Interest (OI): Increased by 1,027 contracts.
-
Futures Volume: Bank Nifty Aug Futures Open Interest Volume stood at 20.6 lakh, with a minor liquidation of 0.02 Lakh contracts.
-
Cost of Carry: The increase in the Cost of Carry implies there was a liquidation of SHORT positions at lower levels.
Market Breadth & Rollover Data
-
Advance-Decline Ratio: Stood at 04:09, indicating slight weakness in banking constituents.
-
Rollover Cost: Bank Nifty Rollover Cost is placed at 57,177, and crucially, the index managed to close above this level.
Bank Nifty Option Chain Analysis
-
CMP: 57,446
-
PCR (Put-Call Ratio): 0.82 (Slightly oversold, room for bounce)
-
Max Pain Level: 57,800
-
Key Resistance (Highest Call OI): 58,000
-
Key Support (Highest Put OI): 57,000
Gann & Astro Analysis
Bank Nifty saw a sharp correction in the last session, but the price action was far from random. The exact low of 57,158 perfectly kissed the crucial 1×1 Gann Angle—the ultimate equilibrium line where price and time balance. This 45-degree angle acts as a major line in the sand; as long as the price holds above it, the structural uptrend remains intact, but a break signals a deep trend reversal.
Adding significant weight to this technical setup, today (12 Aug 2026) marks a Total Solar Eclipse. In Financial Astrology, solar eclipses create massive energy shifts that trigger major market resets. Furthermore, today’s date creates a powerful 3-8-1 karmic combination in numerology, a signature historically linked to heightened volatility and structural turning points.
The Astro Trade Plan:
You must mark today’s High and Low on your charts. The range formed during this eclipse will act as a major decision box for the entire quarter.
-
Bulls’ Line in the Sand (Upside): For the uptrend to resume, bulls absolutely need to force a daily close above 57,541. Sustaining above this pivot will clear the immediate overhead supply and trigger a swift move towards 57,719, with the ultimate target at the psychological 58,000 mark.
-
Bears’ Line in the Sand (Downside): If the index breaches and sustains below 57,350, it signals a definitive breakdown of the 1×1 Gann support. In this scenario, expect bears to aggressively take control, dragging the price down towards the next support zones at 57,108 and 56,900.
Pro Tip: Astro-heavy dates often experience wild swings and potential tape latency. Strictly trade level-to-level and let the price confirm the breakout or breakdown before committing size.
Intraday Reversal Astro Timings: Traders should watch out for potential intraday trend reversals or spikes in momentum at these specific times: 09:15 | 11:37 | 12:42 | 02:01
Trend Change Levels
Trading around these pivot levels helps you stay on the same side as institutions with a much higher risk-reward ratio.
-
For Positional Traders: The Bank Nifty Futures’ Trend Change Level is at 57,764. Going Long or Short above or below this level will define the broader swing trend.
-
For Intraday Traders: Keep a close eye on 57,574, which acts as today’s Intraday Trend Change Level.
Bank Nifty Spot – Intraday Technical Setup
Market Observation: The index is currently trading within a defined range. Traders should watch the following pivot zones for potential directional moves.
-
Strength (Upside): Bulls need to close above 57,541 for a structural move towards 57,719 / 58,000. If the index sustains above 57,500, it indicates fresh bullish momentum.
-
Immediate Resistance Levels: 57,649 / 57,853 / 58,000
-
-
Weakness (Downside): Selling pressure is likely to intensify if the index breaks and sustains below 57,350. Bears taking control below this zone can see a swift fall towards 57,108 / 56,900.
-
Immediate Support Zones: 57,200 / 56,954 / 56,751
-