


Disclaimer
This analysis represents the highest-probability forecast derived from expert, multi-decade historical evaluation of astrological signatures and their documented correlation with market psychology and price action.
No Guarantee
This is not a guarantee of future market performance. Financial markets are influenced by numerous dynamic and unpredictable real-world factors. All trading and investment activities carry significant risk, including the potential loss of principal.
Educational Purpose Only
This content is strictly for informational and educational purposes and should not be construed as financial advice or a recommendation to buy, sell, or trade any financial instrument.
Consult a Professional
We strongly advise you to consult a qualified financial advisor before making any investment decisions. Any actions you take based on this analysis are solely your responsibility. We assume no liability for any financial profits or losses that may occur.
Theme for Nifty : The Velocity Mirage and the 4-Day Speed Trap
The dominant theme for Nifty is deceptive momentum compressed into a shortened week. While we open with a gap up following Gift Nifty strength, the astrological backdrop is governed by Bayer Rule 2. With the speed differential between Mars and Mercury hitting the critical 59-minute threshold on April 26, Nifty enters a high-probability “Big Move” window. Historically, this signature acts as a “Velocity Trap”—an initial burst of speed that quickly exhausts itself. Because the week ends early, the theme is one of “Accelerated Exhaustion.” The struggle between the “Gemini-I Uranus” ingress and the cooling Mars-Mercury calibration will lead to a truncated but violent price cycle.
For a Detailed Day by Day Forecast with Neural Analysis Please watch the below video
Nifty Harmonic Pattern
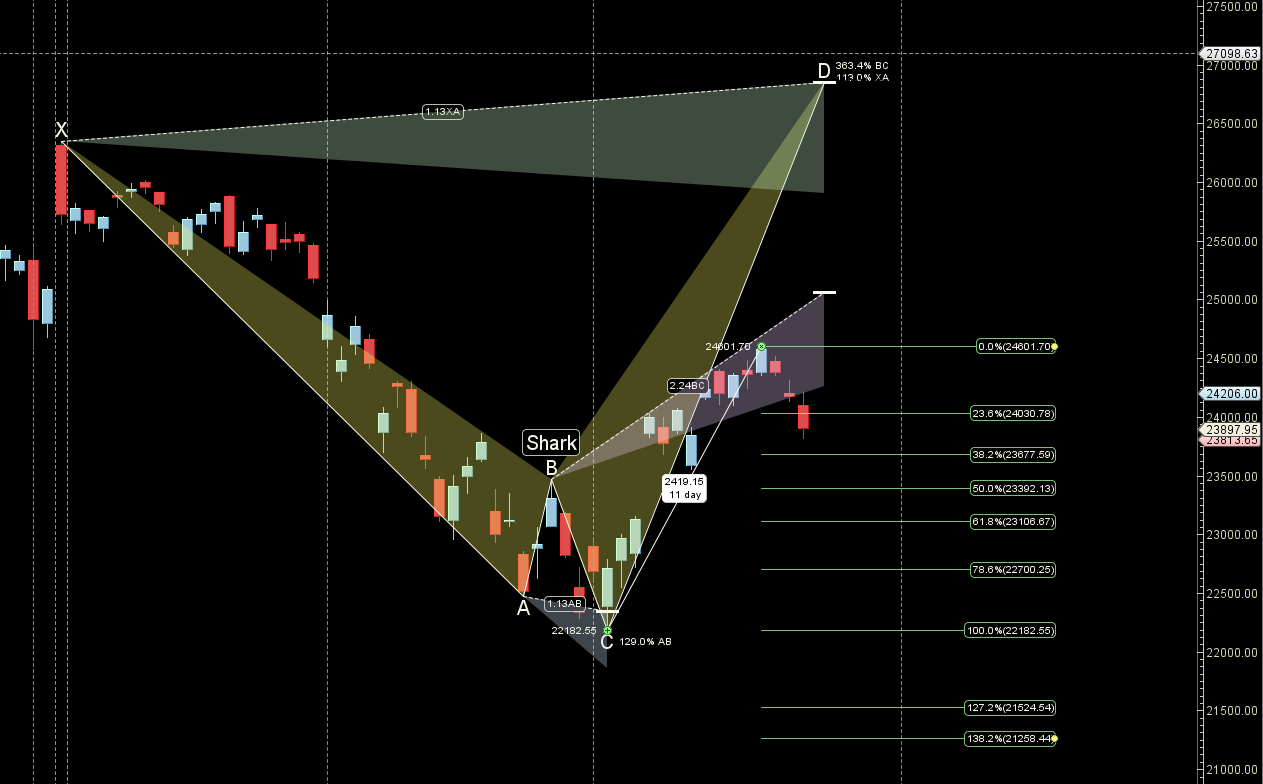
Price holding 23577 can see rally towards 24330/24555
Nifty Gann Angles
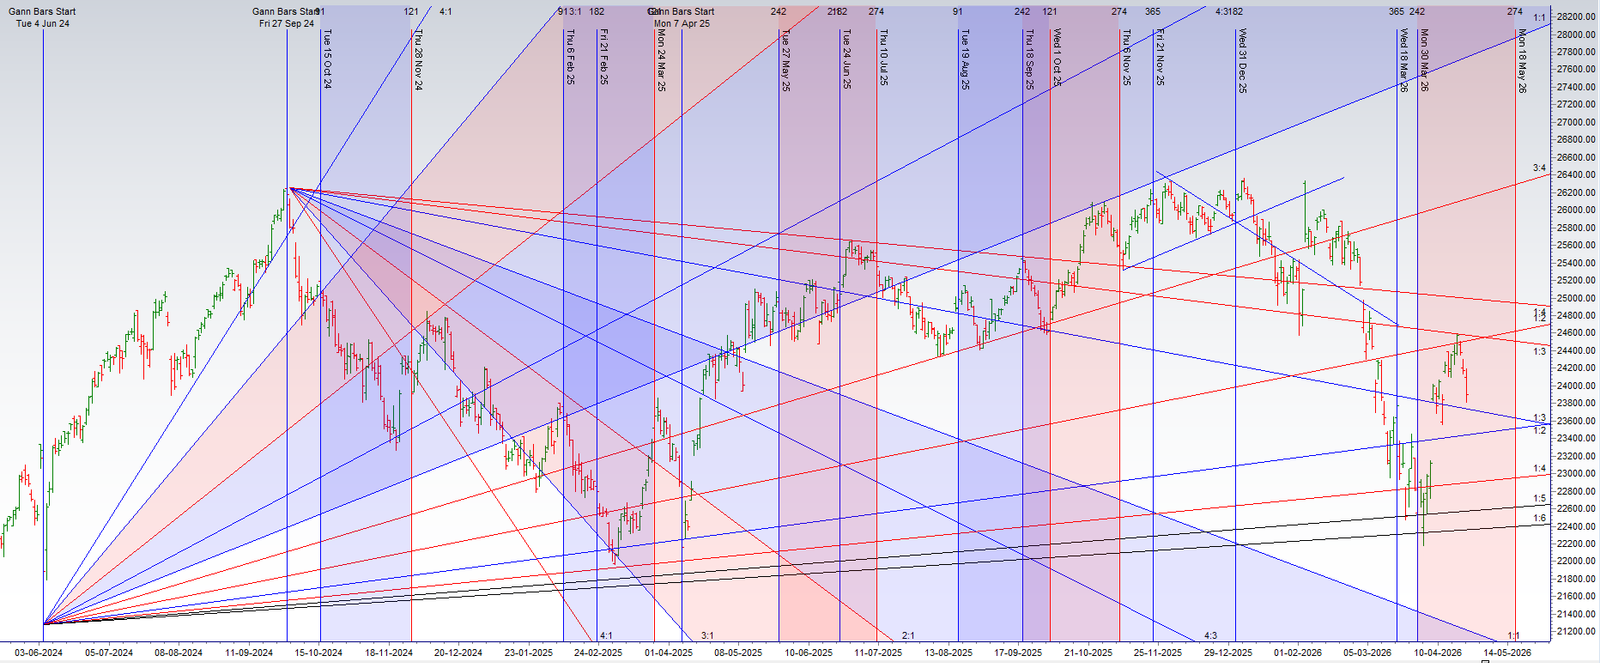
Price is trading near its 1×3 gann angle zone
Nifty Supply and Demand
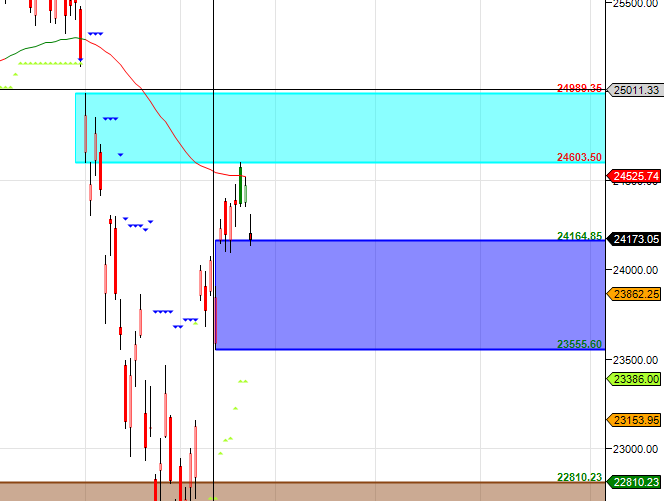
Self Explanatory Chart
Nifty Time Analysis Pressure Dates
Key Pivot Dates: Watch 29 April
Nifty Weekly Chart
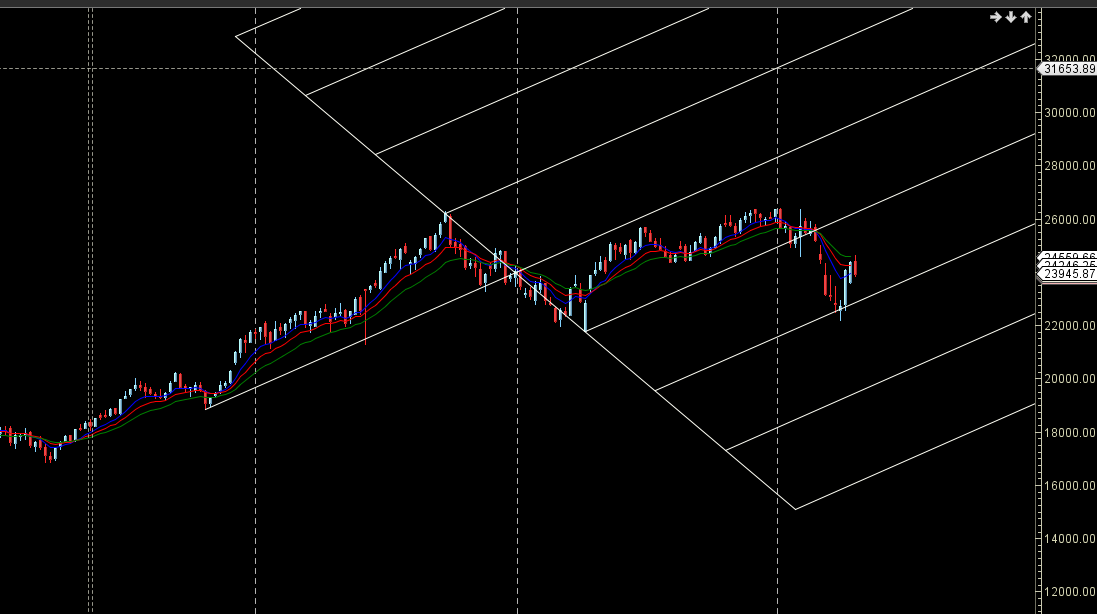
Nifty rallied big time from AF support zone range of 24256-24300 is supply zone.
Nifty Monthly
24119 is Monthly resistance zone 23555 is Monthly Support zone.
Nifty Weekly Levels
Nifty Trend Deciding Level: 23998
Nifty Resistance: 24076 24154 24232 24310
Nifty Support: 23920 23842 23764 23686
Levels mentioned are Nifty Spot
As always I wish you maximum health and trading success
Learn More:
W.D. Gann Trading Strategies – Learn how to decode markets using price, time, and geometry.
Trading Using Financial Astrology – Discover how planetary motion impacts market behavior and how to trade it effectively.
Ready to Trade Like a Time-Master?
Join our one-on-one mentorship to master astro-timing, Gann analysis, and institutional-grade setups.
Call: 09985711341
Email: bhandaribrahmesh@gmail.com