


A Hollow Rally: FIIs Take Massive Profits as Retail Chases a Dangerous Short Squeeze
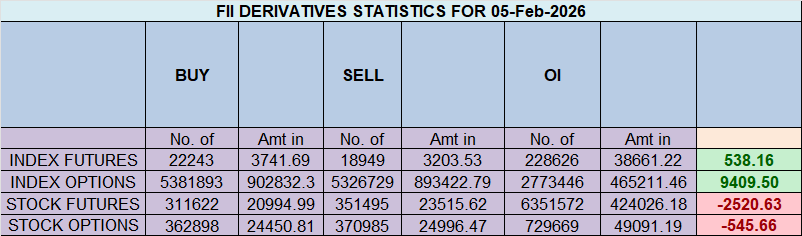
On February 5, 2026, the Nifty Index Futures market presented a spectacular, yet deeply deceptive, picture of institutional confidence. While the headline showed a strong net buy of 3,988 contracts by Foreign Institutional Investors (FIIs), a deeper dive into the data reveals this was not a new bullish endorsement. Instead, it was a masterful execution of a massive profit-taking operation conducted during a violent, retail-fueled short squeeze.
The day’s most critical and revealing event was the colossal collapse in net Open Interest (OI), which plummeted by 5,794 contracts. This is the definitive signature of an unhealthy, unsustainable rally built not on a strong foundation of new buyers, but on the weak foundation of old players exiting en masse.
Decoding the Data: The Anatomy of a Deceptive Rally
1. The FIIs’ “Bullish” Disguise: Cashing in Their Winning Bets
The FII granular data unmasks their true, brilliant strategy. Their “buy” number was almost entirely driven by the covering of a colossal 4,884 short contracts.
-
This is not a new bull bet; it is the strategic closing of an immensely profitable bear campaign. After successfully riding the trend down, they are using the market’s upward panic and retail’s aggressive buying as the perfect exit liquidity.
-
The definitive proof is in their final positioning: they remain profoundly bearish at 19% long versus 81% short (ratio 0.22). They have not flipped their view; they have simply realized enormous profits.
2. The Main Event: The Retail Chase and the OI Collapse
The retail clients were the primary fuel for this squeeze. Their actions reveal classic late-stage, emotional trading:
-
They aggressively added 5,341 new long contracts, chasing the rally and providing the buy orders the FIIs needed to sell their shorts into.
-
Simultaneously, they covered 1,989 short contracts, removing their hedges and downside protection at a potential market top.
-
All this activity took place in a market that was “hollowing out,” as confirmed by the massive OI collapse. This proves the rally had no broad-based support.
Key Implications for the Market
-
A Textbook Short Squeeze: The rally is being fueled by the forced, panicked buying of trapped short-sellers and the euphoric chasing of retail longs, not by new, confident institutional capital.
-
Profound Trend Exhaustion: A rally on collapsing OI is the weakest and most dangerous kind. The primary participants are exiting the market, signaling the end of a major cycle.
-
A Brittle and Extremely Fragile Market: Once the forced short-covering is complete, the primary source of buying pressure will evaporate instantly. This leaves the market exceptionally vulnerable to a sudden and violent reversal, often called a “rug pull.”
-
The Risk has Inverted: The primary risk is no longer being left behind by the rally. The primary risk is now getting trapped in a euphoric rally at the exact moment the “smart money” is cashing out.
Conclusion
Disregard the headline FII “buy” figure. The dominant and undeniable story is of a massive short squeeze and a masterful profit-taking operation by the FIIs, enabled by the euphoric and ill-timed chasing of retail clients. The old bear trend is over, but the new rally is built on the most fragile foundation possible. The risk of a sharp reversal is now extremely high.
Last Analysis can be read here
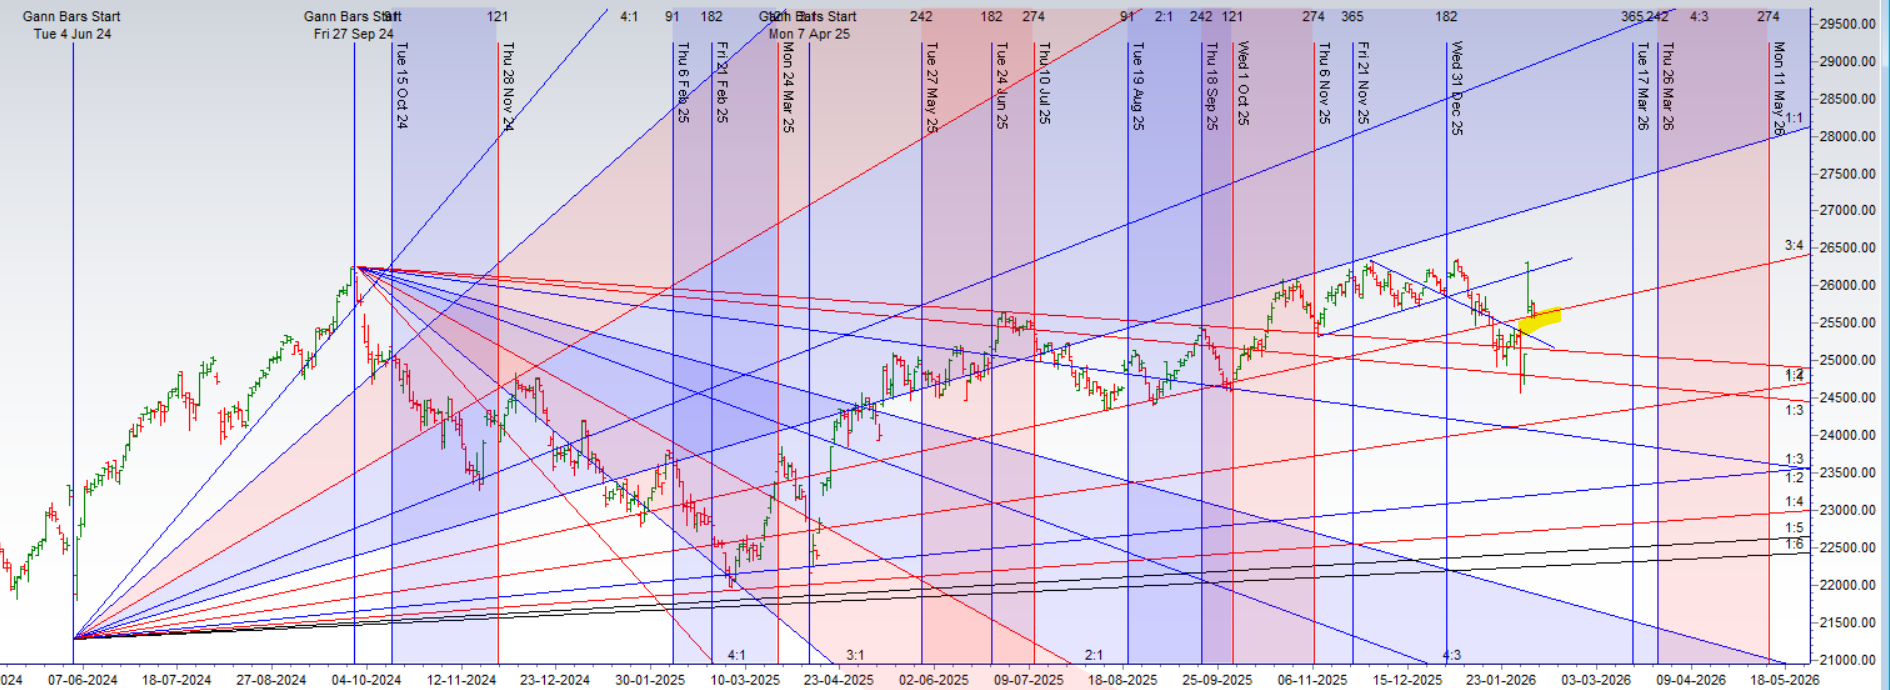
The Nifty is in a state of profound and suspenseful consolidation, having formed a classic “Inside Bar” pattern ahead of today’s crucial RBI policy decision. This technical signature of a narrowing range is a clear sign of a market holding its breath, building immense potential energy before a major, catalyst-driven move.
This state of technical indecision is about to be violently resolved. A gap-down opening, driven by weakness from Wall Street, is set to test the market’s resolve from the very first second. However, this gap-down is not random; it is guiding the price directly to its most critical technical support: the 3×4 Gann angle. This creates a high-stakes “make-or-break” scenario at the open. Furthermore, a new astrological event—a Mercury sign change—is set to inject a fresh wave of volatile, communicative energy into the session, amplifying the market’s reaction to the policy news.
The Bullish Defense: A Recovery from the Gann Line
The bulls have one critical mission: defend the Gann angle support and absorb the initial selling pressure. The battle for control will be fought in this key zone.
-
The Bullish Fortress: 25,555 – 25,610.
-
The Condition: If the bulls can successfully hold this range after the RBI policy announcement, it will signal that the gap-down was a successful test of support, not a breakdown.
-
The Outcome: A successful defense is expected to trigger a quick and powerful recovery rally towards the next resistance levels of 25,729 and 25,800.
The Bearish Assault: Breaking the Final Support
The bears will view the gap-down as their opportunity to seize control and initiate the next major leg down. Their path is clear.
-
The Breakdown Trigger: 25,450.
-
The Condition: The bears will only gain the definitive upper hand if they can force a sustained break below this level, confirming that the Gann angle support has failed.
-
The Outcome: A breach of 25,450 would be a major technical breakdown, likely unleashing a wave of aggressive selling.
The Intraday Compass for a Volatile Day
Given the potent combination of the RBI policy and the Mercury sign change, a clear tactical plan is essential to navigate the expected chaos. The first 15 minutes’ high and low will be the ultimate guide. It will cut through the initial, emotional, news-driven noise and reveal the true, dominant intraday trend that emerges once the dust has settled.
Conclusion
The Nifty is a coiled spring at a critical support juncture, waiting to be unleashed by two powerful catalysts. The initial gap-down will test the 3×4 Gann angle immediately. The market’s ability to hold the 25,555-25,610 support post-policy will determine if a sharp recovery is in the cards. A failure to do so, breaking below 25,450, will signal a new and powerful wave of selling. Use the 15-minute rule to trade what the market does, not what it might do. Prepare for a session of extreme volatility.
Turning Trading Regrets into Tuition: How to Learn from Your Worst Decisions
Traders may watch out for potential intraday reversals at 09:51,10:42,12:24,01:33,02:34 How to Find and Trade Intraday Reversal Times
Nifty Dec Futures Open Interest Volume stood at 1.55 lakh cr , witnessing addition of 1 Lakh contracts. Additionally, the increase in Cost of Carry implies that there was addition of SHORT positions today.
Nifty Advance Decline Ratio at 19:31 and Nifty Rollover Cost is @25405 closed above it.
In the cash segment, Foreign Institutional Investors (FII) sold 2150.51 , while Domestic Institutional Investors (DII) bought 1129.82 cr.
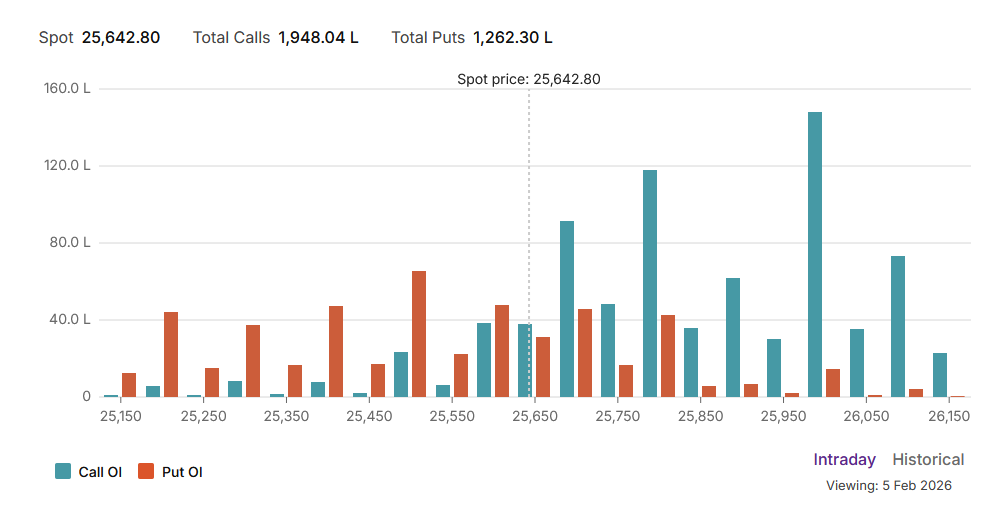
The Nifty options market is screaming a message of intense bearish pressure and a significant loss of bullish confidence. A deeply negative Put-Call Ratio (PCR) of 0.64 signifies a market that has fallen firmly under the control of sellers. This extremely low reading confirms that the open interest in call options has overwhelmingly surpassed that of puts, a direct result of aggressive call writing from participants who are confident that the market’s upside potential has been severely and definitively capped.
This bearish environment has pinned the index in a tight gravitational orbit around the Max Pain point of 25,650. With the spot price trading almost exactly at this level (25,642.80), the market is perfectly anchored at the point of maximum financial pain for option buyers. This is a classic signature of a market being controlled by large institutional option sellers who are dictating the terms of engagement.
The participant data, while ambiguous in its raw form, supports the structural view of institutions likely selling calls to a retail audience buying them with hope. This dynamic has forged a clear and formidable battlefield:
-
Resistance: A massive, multi-layered “Great Wall of Calls” stands at the 25,800 and, more importantly, the 26,000 strikes, serving as the ultimate ceiling for any potential rally.
-
Support: On the downside, a significant support floor has been built by put writers at the 25,500 strike, which acts as the primary line of defense for the bulls.
In conclusion, the Nifty is firmly in a bear grip, dominated by negative sentiment and overwhelming overhead supply. The path of least resistance is sideways to down, with any rally likely to be sold into aggressively. A major catalyst is needed to break the stalemate defined by the support at 25,500 and the immense resistance at 25,800.
For Positional Traders, The Nifty Futures’ Trend Change Level is At 25456. Going Long Or Short Above Or Below This Level Can Help Them Stay On The Same Side As Institutions, With A Higher Risk-reward Ratio. Intraday Traders Can Keep An Eye On 25729 , Which Acts As An Intraday Trend Change Level.
Nifty Spot – Intraday Chart Observation
Technical Setup: The index is approaching critical breakout levels. Watch these zones for price action confirmation:
-
Strength (Upside): Momentum is expected to pick up if Nifty sustains above 25610 . In this scenario, the immediate resistance levels are 25651, 25700, and 25743.
-
Weakness (Downside): The trend technically weakens if the index slips below 25555. This could open the path towards support levels at 25512, 25470, and 25416.
Wishing you good health and trading success as always.As always, prioritize your health and trade with caution.
As always, it’s essential to closely monitor market movements and make informed decisions based on a well-thought-out trading plan and risk management strategy. Market conditions can change rapidly, and it’s crucial to be adaptable and cautious in your approach.
► Join Youtube channel : Click here
► Check out Gann Course Details: W.D. Gann Trading Strategies
► Check out Financial Astrology Course Details: Trading Using Financial Astrology
► Check out Gann Astro Indicators Details: Gann Astro Indicators