


FIIs Unleash a Massive Short Squeeze, But a Deeper Bullish Signal Emerges
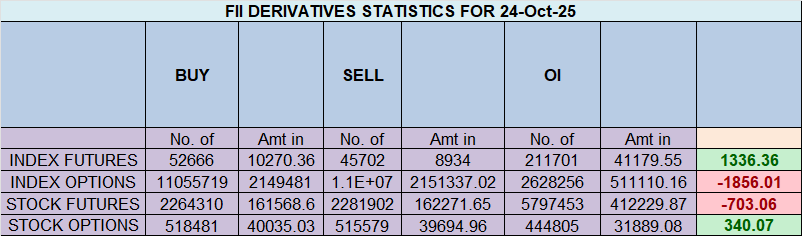
The trading session of October 24, 2025, was a day of explosive and transformative market action. The headline number is breathtaking: Foreign Institutional Investors (FIIs) were massive net buyers, acquiring 6,295 contracts worth a colossal ₹1,208 crores. However, as seasoned traders know, the true story is never just in the headline. The simultaneous decrease in net open interest (OI) by 6,221 contracts immediately identifies the primary driver of this rally: a massive and aggressive short squeeze.
But even that is not the full story. Beneath the surface of this squeeze lies the first truly significant and genuine bullish signal from the FIIs in weeks.
The Anatomy of the Squeeze: A Forced Capitulation
The breakdown of FII activity reveals the mechanical nature of the day’s rally. The primary engine was the covering of a monumental 6,239 short contracts. This was the sound of bears capitulating. The buying was technically driven and forced, as FIIs rushed to lock in profits on their old bearish bets, creating a vacuum that pulled prices sharply higher.
The fuel for this squeeze was provided directly by the Client (retail) segment, which was also seen covering a massive 6,229 short contracts. This is a classic capitulation scenario where weak shorts, likely retail traders, are forced out of their positions by a sharp upward move, and their buying-to-cover action allows the institutional shorts to exit profitably.
The Hidden Signal: The First Shoots of Genuine Bullish Conviction
However, the most important and forward-looking piece of data from the entire session was a subtle but powerful action by the FIIs. While they were busy covering their old shorts, they also added 725 new long contracts.
This is a profound change in character. For the first time during this entire reversal, this is not just about profit-taking; it is about initiating new bullish bets. It signals that the FIIs are not just content to be neutral; they are now beginning to see value on the long side and are starting to build a new bullish foundation. This is the first concrete evidence that their strategic outlook is beginning to pivot from bearish to bullish.
A Market Reset: The Shifting Tides of Positioning
This dual action of covering shorts and adding longs has significantly improved the market’s structure. The FII Long/Short ratio has jumped to 0.33 (25:65). While they remain net short on a legacy or stock basis, the flow of funds is what dictates the future trend. The aggressive reduction of their short book, combined with the initiation of new longs, is a powerfully bullish flow.
Meanwhile, the retail segment, after being whipsawed, is de-leveraging and remains heavily positioned on the long side (65:35), making them the new vulnerable party if the market’s newfound institutional strength continues.
Conclusion:
While the spectacular rally on October 24th was primarily fueled by a massive short squeeze, traders must not miss the more significant underlying signal. The FIIs’ addition of new long contracts is the first tangible sign of genuine bullish conviction we have seen from them in a long time. This is a game-changer. The market structure has been cleansed of weak shorts, and a new institutional buying impulse has emerged. The path of least resistance has now decisively shifted to the upside, and any minor dips are now more likely to be seen as buying opportunities. The tide has turned.
Last Analysis can be read here
The Nifty has arrived at a momentous and potentially historic inflection point. The recent powerful rally has not just run out of steam; it has collided with a perfect and formidable confluence of Gann’s most sacred principles of price, time, and pattern. The evidence is clear and compelling: a major topping process is underway, and the market has flashed multiple, high-probability signals that the bears are poised to take decisive control.
The Grand Cycle: A Perfect Squaring of Price and Time
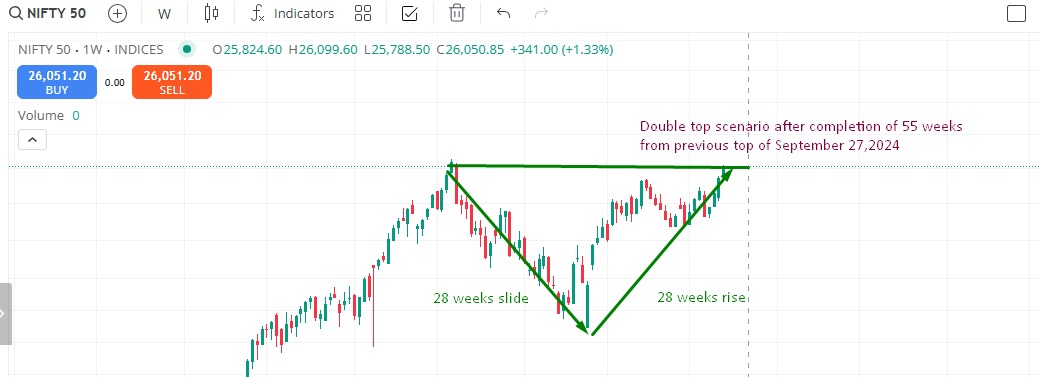
At the highest level, the market has just completed a cycle of perfect and profound symmetry. As highlighted in our recent charts, the Nifty has executed a flawless balancing of price and time:
-
The Fall: A 28-week decline.
-
The Rise: A subsequent 28-week advance.
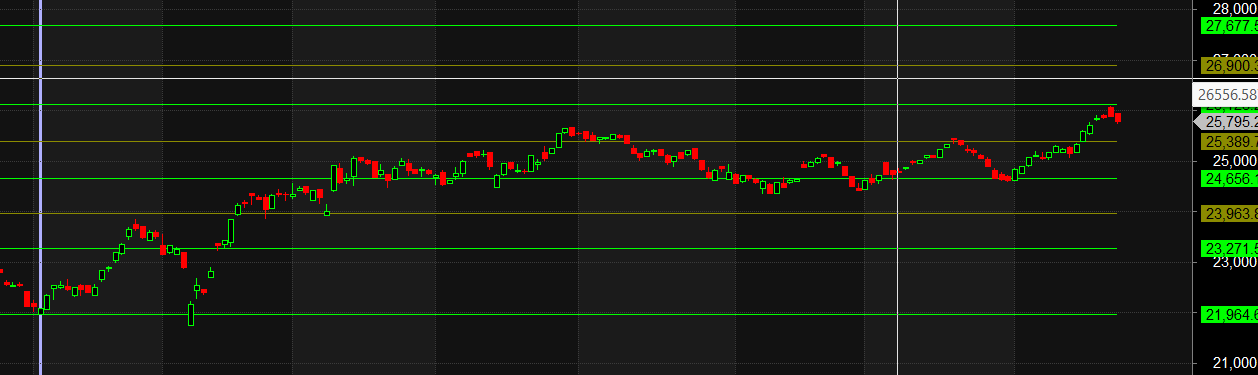
In the world of W.D. Gann, this “squaring” of a time cycle is one of the most powerful and reliable signals for a major trend reversal. It represents the completion of a grand cycle, a point of natural equilibrium where the energy that fueled the preceding trend is exhausted. This is not a minor signal; it is a long-term, structural red flag. This has established the level of 26104 as the critical macro “line in the sand.” As long as the bulls are unable to break this level, the bears will rule the market.
The Price Confirmation: A Brutal Rejection at the 1×1 Gann Angle
This powerful time-based signal was confirmed with textbook precision by the price action. The rally was halted exactly at the most important and powerful of all Gann angles: the 1×1 angle. This angle represents the perfect balance of one unit of price for one unit of time. A rejection from this angle is a significant bearish event, confirming that the upward momentum has met a wall of resistance that is in perfect harmony with the market’s natural geometry.
This price failure was visually confirmed by the formation of a weekly Gravestone Doji. This is a classic and potent reversal candlestick pattern. It signifies that the bulls attempted a powerful rally during the week, but were completely overpowered by the bears, who pushed the price all the way back down to close near the weekly open. It is the footprint of a failed auction and a decisive victory for the sellers at a critical resistance point.
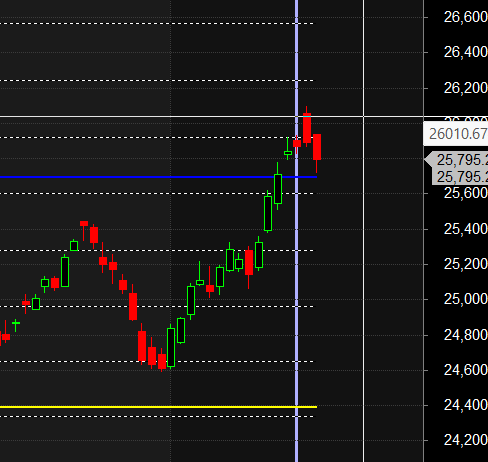
The Immediate Trigger: The 25718-25700 Activation Level
While the long-term picture is bearish, a pattern is only a signal until it is activated. The confirmation for this entire bearish setup lies in a single, critical price level for Monday’s session: 25718.
A decisive break and close below 25718 will activate the Gravestone Doji, confirming that the sellers have follow-through momentum. This is the most important short-term level for all traders to watch. A break of this level would be the starting gun for the next major downward leg.
A Final Ominous Clue: The Weak Friday Close
Adding further weight to the bearish case is the nature of the weekly close. The market closed near the lowest point of the week on Friday. As per Gann’s rules, a low made on a Friday is a weak close and often suggests that the selling pressure will continue into the following week. This bearish momentum at the close increases the probability that the 25718 trigger will be breached. The logical next target for this downward move would be the psychological support zone around 25500.
Conclusion:
The evidence is overwhelming and points in a single direction. We have a rare and powerful confluence of four major bearish signals:
-
A perfect 28-week squaring of time.
-
A rejection from the 1×1 Gann Angle.
-
The formation of a weekly Gravestone Doji.
-
A weak Friday close.
The market is at a high-probability turning point. The risk is now heavily skewed to the downside. The key trigger to watch is 25718. A break below this level will confirm that the bears are in full control and a new, significant downtrend is underway.

Nifty Trade Plan for Positional Trade ,Bulls will get active above 25861 for a move towards 25942/26023. Bears will get active below 25700 for a move towards 25619/25538
Traders may watch out for potential intraday reversals at 10:19,11:29,12:34,01:49 How to Find and Trade Intraday Reversal Times
Nifty Oct Futures Open Interest Volume stood at 1.28 lakh cr , witnessing liquidation of 28 Lakh contracts. Additionally, the increase in Cost of Carry implies that there was closeure of SHORT positions today.
Nifty Advance Decline Ratio at 16:34 and Nifty Rollover Cost is @24980 closed above it.
Nifty Gann Monthly Trend Change level 25555 closed above it.
Nifty has closed above its 21 SMA @ 25555 Trend is Buy on Dips till above 25700
Market Hits Extreme Optimism, But FIIs are Quietly Buying Protection
The options market is currently sending a loud and clear signal of extreme bullish sentiment, verging on outright euphoria. The two primary indicators both point to a market that has become overwhelmingly one-sided. The Put-Call Ratio (PCR) has plummeted to a deeply bullish 0.65. A PCR this far below the neutral 1.0 mark is a rare reading, indicating that Call option activity is dramatically outpacing Put activity. This is the signature of a market that has little to no fear of a decline.
This bullishness has pushed the Max Pain level higher to 25800, which now acts as the market’s primary fulcrum and a powerful support base that option writers will seek to defend. However, beneath this surface of extreme optimism lies a critical and telling divergence in how the “smart money” is positioning itself compared to the retail crowd.
The Retail & FII Stance on the Upside: A Surprising Agreement
In a rare moment of agreement, both retail traders and Foreign Institutional Investors (FIIs) were significant net sellers of Call options. Retail was net short by a massive 114,000 contracts, and FIIs were net short by a smaller but still significant 19,000 contracts.
This is a crucial piece of the puzzle. It means that while the market is euphoric, the major participants are not betting on a runaway rally from these levels. They are actively selling the upside, collecting the high premiums that the optimistic Call buyers are willing to pay. This action is building a formidable wall of resistance at higher levels.
The Key Divergence: The “Smart Money” Hedge
The entire story, and the most important strategic signal, is found in the Put options.
-
Retail Traders were small net sellers of Puts. This reinforces their confidence, as they are willing to take on the risk of a decline to collect a small premium.
-
Foreign Institutional Investors (FIIs), in stark contrast, were net buyers of Puts.
This is the classic “smart money” hedge. While the crowd is euphoric and sees no risk, the FIIs are using this period of low volatility and cheap Put premiums to professionally hedge their portfolios and buy insurance against a sharp, unexpected reversal. They are participating in the rally but are not doing so without a safety net.
Option Chain Support and Resistance
This strategic positioning has carved out clear and powerful levels on the option chain:
-
Resistance: The massive, combined Call writing from both retail and FIIs has created a formidable supply wall overhead. The highest concentration of Call open interest is now fortified at the 25900 and, more significantly, at the psychological 26000 strike, which now acts as a major ceiling.
-
Support: The Max Pain level at 25800 forms the new primary support base. The next significant level of Put open interest is located at 25700, forming a secondary floor.
Conclusion
The market is currently in a dangerous state of extreme bullish complacency (evidenced by the 0.65 PCR). While the trend remains up, the institutional players (FIIs) are sending a clear warning signal by quietly buying downside protection. The market is ripe for a “rug pull” or a sharp reversal that would catch the overly optimistic crowd off guard. The path of least resistance may still be slightly higher, but the risk of a swift and punishing correction has increased dramatically.
In the cash segment, Foreign Institutional Investors (FII) bought 621 cr , while Domestic Institutional Investors (DII) bought 1208 cr.
Traders who follow the musical octave trading path may find valuable insights in predicting Nifty’s movements. According to this path, Nifty may follow a path of 23037-23722-24408-25134-25860 This means that traders can take a position and potentially ride the move as Nifty moves through these levels.Of course, it’s important to keep in mind that trading is inherently risky and market movements can be unpredictable.
For Positional Traders, The Nifty Futures’ Trend Change Level is At 25401. Going Long Or Short Above Or Below This Level Can Help Them Stay On The Same Side As Institutions, With A Higher Risk-reward Ratio. Intraday Traders Can Keep An Eye On 25853 , Which Acts As An Intraday Trend Change Level.
Nifty Intraday Trading Levels
Buy Above 25816 Tgt 25850, 25888 and 25925 ( Nifty Spot Levels)
Sell Below 25743 Tgt 25707, 25666 and 25610 (Nifty Spot Levels)
Wishing you good health and trading success as always.As always, prioritize your health and trade with caution.
As always, it’s essential to closely monitor market movements and make informed decisions based on a well-thought-out trading plan and risk management strategy. Market conditions can change rapidly, and it’s crucial to be adaptable and cautious in your approach.
► Join Youtube channel : Click here
► Check out Gann Course Details: W.D. Gann Trading Strategies
► Check out Financial Astrology Course Details: Trading Using Financial Astrology
► Check out Gann Astro Indicators Details: Gann Astro Indicators