


Disclaimer: This forecast is based on an interpretation of the provided astrological and cycle data and its potential correlation with market behavior. It is for informational and educational purposes only and should not be considered financial advice. All trading involves significant risk.
General Astrological Theme for the Week
This is a “Week of Extremes,” characterized by major turning points at the beginning and end of the week, with a significant bearish plunge in the middle. The week’s narrative is defined by three key phases:
-
The Pivot (Monday): The week kicks off with two powerful turning point indicators on the same day—a Solar Eclipse Degree date and the Moon at its Farthest South declination. This combination creates a very high probability of a significant market extreme (a key high or low) being set on this day.
-
The Plunge (Wednesday): The middle of the week is overwhelmingly negative. A cluster of bearish aspects, including Moon-Pluto, Moon-Jupiter, and a challenging Mercury-Jupiter square, points to a day of significant selling pressure, potential for negative news, and a high probability of a sharp decline.
-
The Reversal (Thursday): A powerful confluence of cycle dates, including a 1-Year Solar Eclipse anniversary and two Bayer Rules, suggests a major reversal. Bayer Rule 8, in particular, explicitly points to upward moves, making this a high-probability day for a sharp bounce or a bottoming process.
The highest probability outcome is a week of high volatility with a key turning point on Monday, a sharp sell-off mid-week, followed by a strong recovery attempt into the latter part of the week.
For Day by Day Forecast Please watch the below video
SENSEX Harmonic Pattern
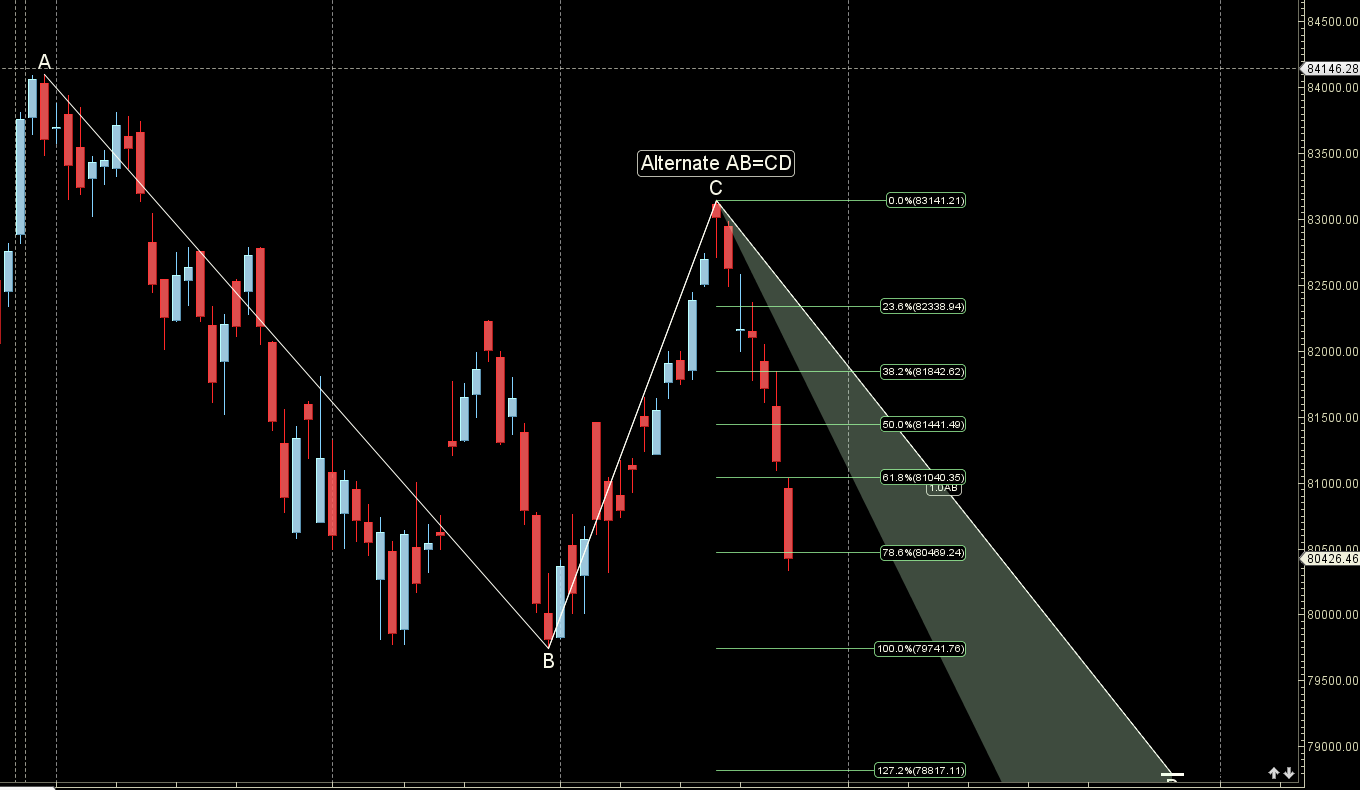
Sensex reacted from its PRZ zone.
SENSEX Gann Angles
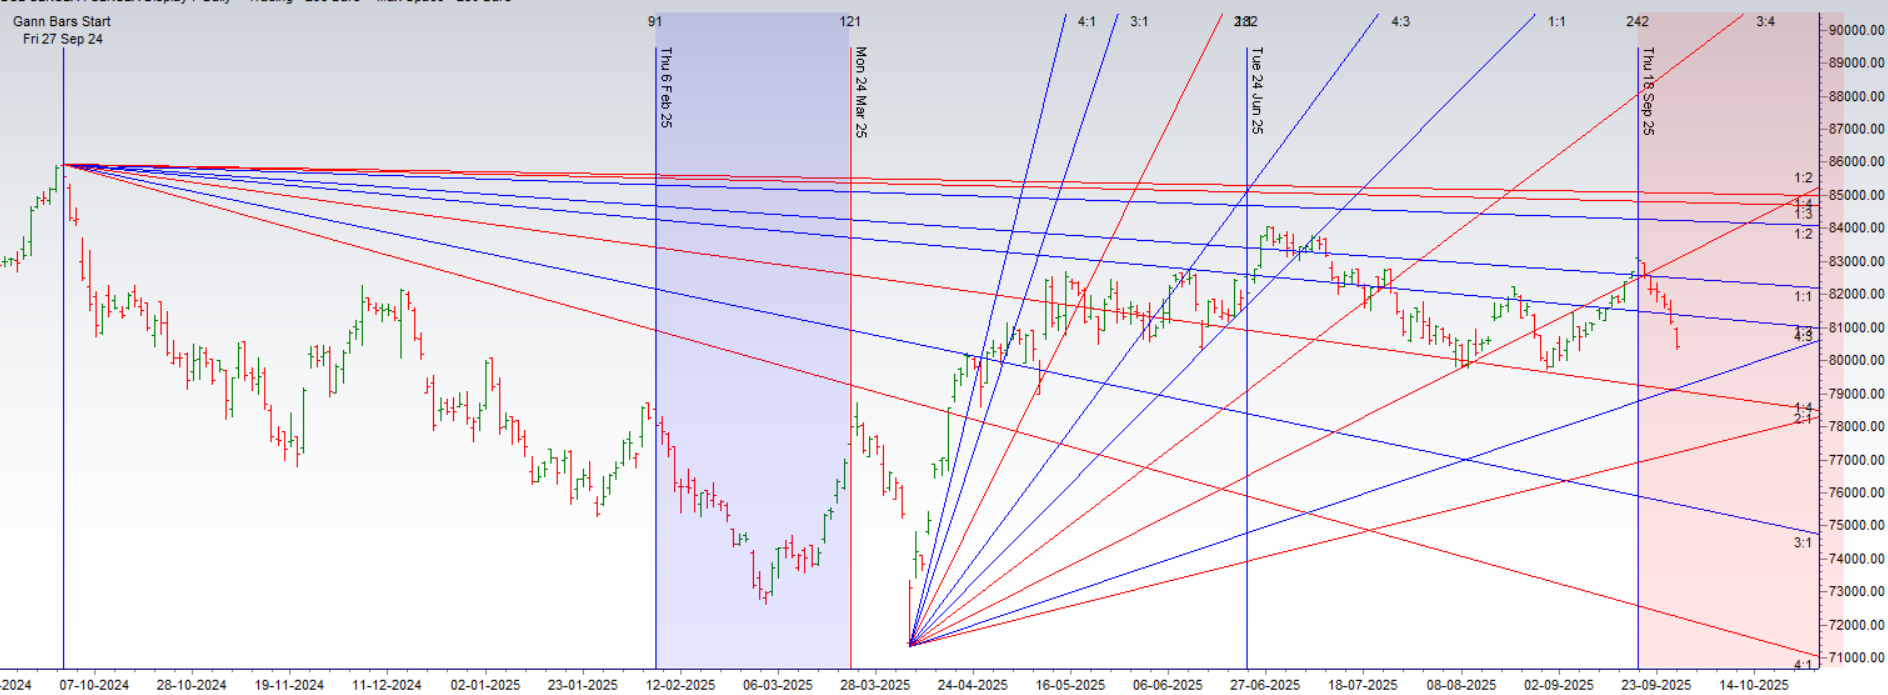
Sensex isheading to its 4×3 gann angle support zone.
SENSEX Supply and Demand
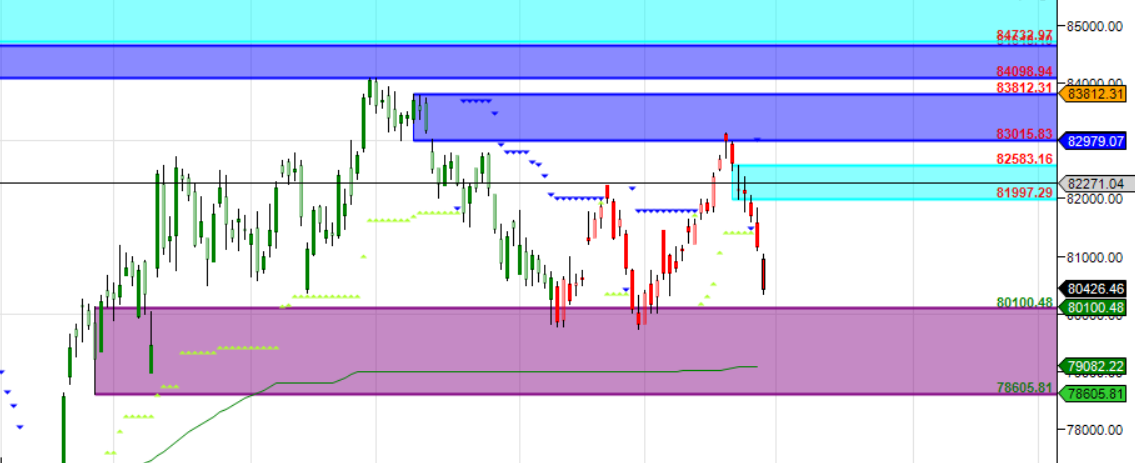
Self Explanatory Chart
SENSEX Time Analysis Pressure Dates
Key Pivot Dates: Watch 29 September
SENSEX Weekly Chart
Bearish Engulfing on Weekly Charts
SENSEX Monthly Charts
81446 is Monthly resistance zone 78957 is Support zone.
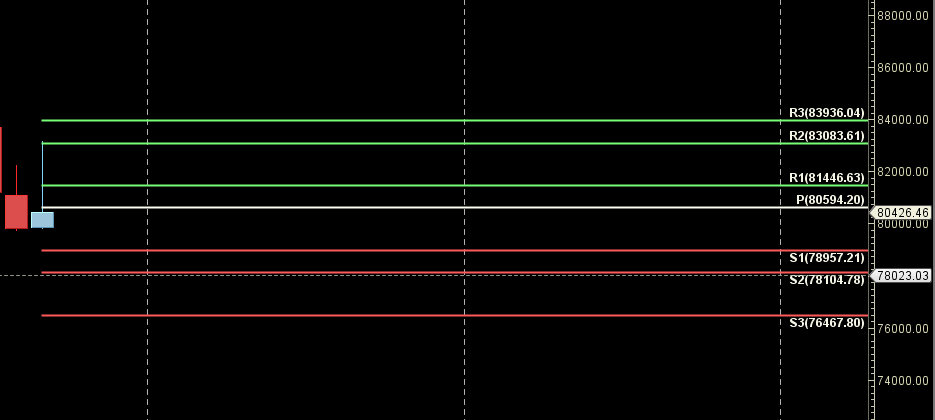
SENSEX Weekly Levels
SENSEX Trend Deciding Level: 80410
SENSEX Resistance: 80696,80982,81268,81554
SENSEX Support: 80124,79838,79552,79225,79000
Levels mentioned are SENSEX Spot
Learn More:
W.D. Gann Trading Strategies – Learn how to decode markets using price, time, and geometry.
Trading Using Financial Astrology – Discover how planetary motion impacts market behavior and how to trade it effectively.
Ready to Trade Like a Time-Master?
Join our one-on-one mentorship to master astro-timing, Gann analysis, and institutional-grade setups.
Call: 09985711341
Email: bhandaribrahmesh@gmail.com