


Market Analysis: FIIs Intensify Bearish Grip on Nifty, Building Fresh Shorts Against Retail Optimism
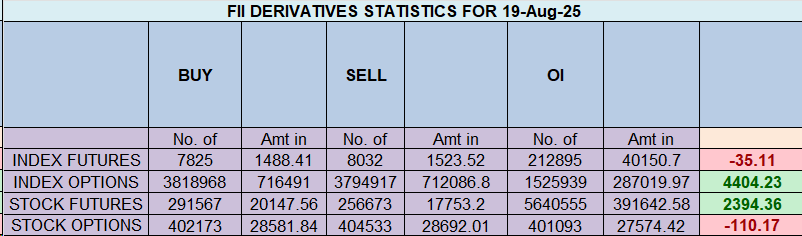
The derivatives data from August 19th paints a starkly bearish picture, revealing that Foreign Institutional Investors (FIIs) are not only maintaining but actively strengthening their negative outlook on the Nifty. By shorting 668 contracts worth ₹125 crore and, more importantly, driving a net increase in Open Interest, FIIs are signaling a high-conviction bet on a market decline. This aggressive short-building stands in direct contrast to the actions of retail/clients, who were seen covering their short positions, setting up a classic “Smart Money vs. Retail” confrontation.
This FII activity serves as a significant red flag, suggesting that any market stability is fragile and the risk of a downward move has increased.
1. Decoding the FII Action: A Deliberate and Aggressive Bearish Stance
The FII data points to a calculated strategy of building bearish exposure, not just managing existing positions.
-
Active Short Building: FIIs added 186 fresh short contracts while only covering a negligible 21 long contracts. The net shorting of 668 contracts confirms that fresh capital was deployed to initiate new bearish bets. This is a far more potent signal than simply selling existing longs, as it demonstrates a proactive belief that the market is poised to fall.
-
Extreme Bearish Positioning: The current FII Long-to-Short ratio stands at an alarmingly low 0.10 (10% long vs. 90% short). This indicates that institutional players are already overwhelmingly positioned for a decline and are still choosing to add to their shorts, reflecting extreme conviction.
2. The Critical Confirmation: Rising Open Interest (OI)
The most crucial piece of evidence supporting the bearish thesis is the increase in net Open Interest.
-
OI Increased by 442 contracts: A rise in OI alongside net shorting activity confirms that new bearish positions are being absorbed by the market. It means that fresh money is funding these bets, rather than old positions simply changing hands.
-
The Classic Bearish Formula: The combination of FII short-selling (price pressure) and rising Open Interest is a textbook technical signal confirming a build-up of bearish sentiment. This makes the market “heavy,” as it increases the number of participants who will profit from—and therefore encourage—a fall in prices.
3. The Contrasting View: Clients Unwind Bearish Bets
While FIIs were digging in their heels, the Client segment displayed the opposite behavior.
-
Net Short Covering: Clients covered a massive 2,482 short contracts while also covering 634 long contracts. Their net action was to significantly reduce their bearish exposure, indicating they believe the downside is limited or a bottom is near.
-
A Clear Divergence: This sets up a classic tug-of-war. The FIIs, or “smart money,” are betting aggressively on a fall, while the retail-dominated Client segment is turning optimistic. Historically, such stark divergences often resolve in favor of the institutional players.
4. Strategic Implications and Market Outlook
This deliberate institutional short-building has critical implications for the Nifty’s immediate future.
-
“Sell on Rise” Environment: With FIIs holding a massive short position, they are highly likely to use any rally or bounce as an opportunity to add more shorts, creating a strong “sell-on-rise” market dynamic.
-
Major Resistance Ahead: The heavy short positions will act as a formidable wall of resistance. Any attempt to break above key technical levels will be met with significant institutional selling pressure.
-
Heightened Downside Risk: The build-up of fresh shorts increases the probability of a breakdown below crucial support levels. If such a level gives way, the selling could accelerate as these newly added FII shorts turn profitable.
Conclusion:
The FII data from August 19th is an unambiguous warning sign. The methodical addition of fresh short positions, confirmed by rising Open Interest and set against an already extremely bearish institutional positioning, indicates that FIIs are preparing for a significant downward move. The opposing optimism from the Client segment only highlights the conviction of the institutional players. For traders, this creates a high-risk environment for long positions and confirms that the path of least resistance for the Nifty remains firmly to the downside.
Avoiding Overtrading and Revenge Trading: Mastering Self-Control
Last Analysis can be read here
The Nifty is currently facing a moment of truth, pinned against a formidable confluence of technical and astrological resistance. The key level of 25000-25025 is acting as a powerful ceiling. The market’s inability to breach this level is now amplified by critical astro-timing events, suggesting that a decisive move is imminent. The failure of bulls to assert control here could quickly shift momentum, opening the door for bears to target the unfilled gap below.
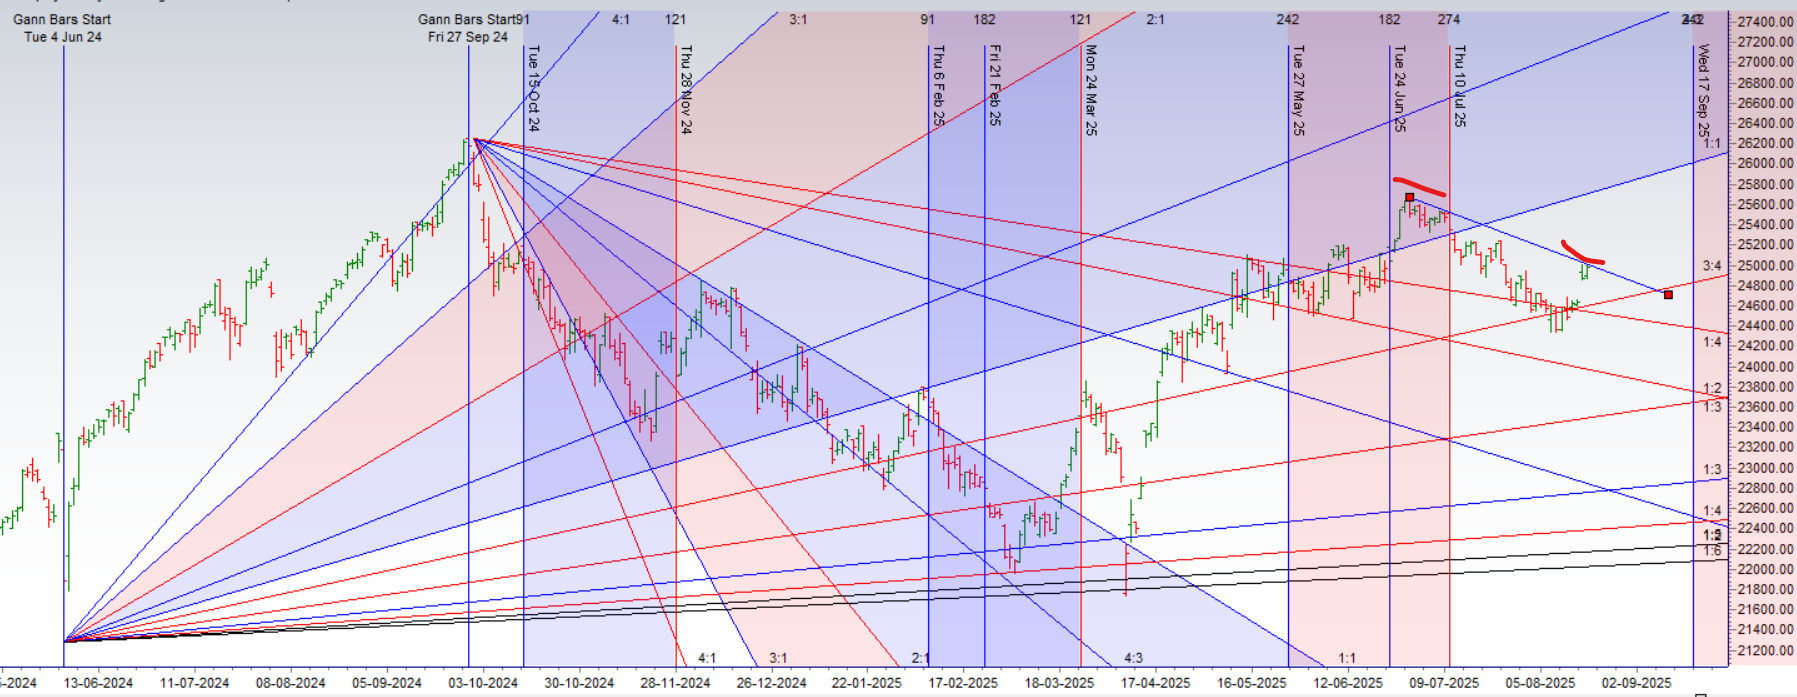
1. The Technical Barrier: The 25012-25025 Gann Angle
The primary obstacle for the bulls is the well-defined resistance at 25012-25025.
-
A Geometric Ceiling: This is not just a psychological round number; its significance is reinforced by its alignment with Gann angle. In Gann theory, these angles represent a structural balance between price and time. A failure to break above such an angle is a strong technical signal that the prevailing upward momentum is exhausted.
-
Confirmation of Weakness: Each rejection from this level strengthens it as a supply zone. If buyers cannot muster the force to push and hold the price above 25025, it confirms that sellers are in control at this price point, making a downward reversal highly probable.
2. The Timing Factor: Astro Cycles Point to an Inflection Point
The technical resistance is occurring within a critical time window flagged by astrological cycles, increasing the odds of a significant market turn.
-
Mercury Declination (Today): This event is often associated with a shift or pivot in market sentiment and trend. Its occurrence while the price is testing major resistance is a significant warning sign that the existing trend could be on the verge of reversing.
-
Bayer Rule 27 (Yesterday): This rule, which identifies potential major tops or bottoms based on Mercury’s speed, has already put the market on high alert. The proximity of these two powerful astro events suggests we are in a high-probability window for a trend inflection. The market is timed for a decision.
3. The Immediate Downside Risk: The Unfilled Gap Magnet
Should the resistance at 2505 hold, the most logical and immediate target for the bears is the unfilled gap on the chart.
-
Price Vacuum at 24631-24852 : Gaps represent price vacuums or imbalances in the market. There is a strong tendency for prices to return to “fill” these gaps. If the upward momentum fails at 25025, this gap will act as a powerful magnet, pulling the price down.
-
A Clear Target for Bears: This provides a well-defined objective for sellers. A rejection from 25012-25025 would likely trigger aggressive short-selling aimed at capturing the move down to the 24631 level.
4. Intraday Game Plan: The Opening Range Breakout
For intraday traders, the market’s initial direction will provide the most critical clue.
-
The First 15 Minutes as a Barometer: Mark the high and low of the first 15 minutes of trading. This range often sets the tone for the rest of the session.
-
Bullish Trigger: A sustained move above the first 15-minute high could signal that buyers are making a credible attempt to challenge the 56,000 resistance.
-
Bearish Trigger: A decisive break below the first 15-minute low would be a strong indication that the bears are taking control and that the path is clear towards the gap fill target.
-
Conclusion:
The Nifty is coiled for a significant move. The bulls face a monumental task in overcoming the combined pressure of Gann resistance and critical astro-timing cycles at 56,000. While a breakout would be powerfully bullish, the path of least resistance appears to be to the downside. A failure to conquer 25000 will likely see sellers take firm control, with the unfilled gap at 24631-24852 as their primary objective. The opening price action will be crucial in signaling which side will win this pivotal battle.
Nifty Trade Plan for Positional Trade ,Bulls will get active above 25013 for a move towards 25091/25055. Bears will get active below 24934 for a move towards 24856/24778
Traders may watch out for potential intraday reversals at 09:15,10:08,11:24,12:40,02:50 How to Find and Trade Intraday Reversal Times
Nifty Aug Futures Open Interest Volume stood at 1.62 lakh cr , witnessing addition of 2 Lakh contracts. Additionally, the increase in Cost of Carry implies that there was covering of SHORT positions today.
Nifty Advance Decline Ratio at 28:22 and Nifty Rollover Cost is @24887 closed below it.
Nifty Gann Monthly Buy Level : 24887
Nifty Gann Monthly Sell Level : 24582
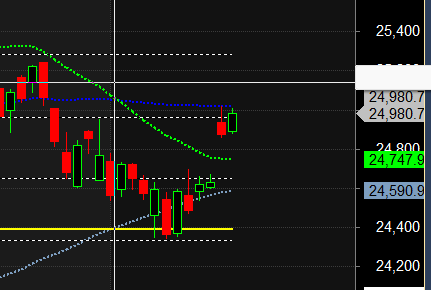
Nifty has closed below its 20 SMA @ 25012 Trend is Buy on dips till above 24750
Nifty options chain shows that the maximum pain point is at 25000 and the put-call ratio (PCR) is at 1.11 .Typically, when the PCR open interest ranges between 0.90 and 1.05, the market tends to remain range-bound.
Nifty 50 Options Chain Analysis
The Nifty 50 options chain indicates that the highest open interest (OI) on the call side is at the 24600 strike, followed by 24700 strikes. On the put side, the highest OI is at the 24500 strike, followed by 24400 strikes. This suggests that the market participants are expecting Nifty 50 to remain range between 24400-24700 levels.
Market Analysis: FIIs Build Aggressive Bullish Bets as Retail Loads Up on Puts in Classic Divergence
The options data from August 19th reveals one of the most significant divergences in market sentiment seen recently, setting up a classic “Smart Money vs. Retail” confrontation. Foreign Institutional Investors (FIIs) have methodically constructed a high-conviction bullish position, aggressively buying calls and simultaneously dismantling their bearish hedges. In stark contrast, retail traders have overwhelmingly positioned for a market downturn, buying a massive volume of puts while selling calls to express their bearish view. This dramatic positioning conflict suggests the market is coiled for a potentially volatile move that could trigger a significant squeeze.
1. Decoding the FII Strategy: A Multi-Pronged Bullish Assault
The FII activity is not just mildly positive; it is a clear, calculated bet on an impending market rally. Their actions across both calls and puts reinforce this single, powerful narrative.
-
Aggressive Call Buying: FIIs added a net 16,400 long call contracts (18.6K long vs. 2.2K short). This is a direct and leveraged offensive play. Buying calls provides maximum participation in an upside move with defined risk, signaling strong confidence that the market is headed higher.
-
The Real Tell—Dismantling Hedges: The most telling action was in the put options. FIIs were net sellers of puts. They closed out 18,700 of their existing long put positions, effectively removing their downside protection or “insurance.” Simultaneously, they wrote (shorted) an additional 11,100 put contracts. This dual action is powerfully bullish: not only do they no longer fear a downturn (closing long puts), but they are now actively selling insurance to others (shorting puts), betting that key support levels will hold firm.
2. The Retail Position: A Wall of Worry and Fear
Retail traders have positioned themselves on the exact opposite side of the trade, constructing a deeply bearish outlook through their options activity.
-
Aggressive Put Buying: The standout figure is the addition of 548,000 long put contracts by retail. This is a massive speculative bet on a market decline or a widespread attempt to hedge existing portfolios in anticipation of a fall. The net addition of 78,000 long put contracts (548K long vs. 470K short) confirms a strong bearish bias.
-
Selling the Upside: In the call options, retail traders were net sellers, shorting 215,000 contracts while only buying 135,000. This strategy, known as call writing, is employed when a trader believes the market will not rise beyond a certain level. By selling calls, they are capping their view of any potential rally and expressing a belief that the upside is limited.
3. Strategic Implications: The Stage is Set for a Squeeze
This extreme divergence in positioning has created a tense and fragile market structure, with conditions ripe for a short squeeze or a sharp, technically-driven rally.
-
The Path of Maximum Pain: In options markets, the trend often moves in the direction that causes the most financial pain to the largest group of participants. In this case, the retail segment is overwhelmingly and vulnerably bearish. An upward move in the market would simultaneously make their long puts worthless and force their short calls into significant losses.
-
Fuel for a Rally: If the market begins to trend upwards, a feedback loop could be triggered. Retail traders who sold calls would be forced to buy them back to cover their escalating losses, adding buying pressure to the market. This forced buying is the very definition of a squeeze and could accelerate the rally, validating the FIIs’ initial bullish position.
Conclusion:
The options data presents a clear and compelling narrative: the “smart money” (FIIs) is confidently and aggressively positioned for a market rally, while the retail crowd is braced for a significant decline. The FIIs’ strategy of buying calls while simultaneously selling puts is a textbook signal of bullish conviction. Given this stark polarity, the market is primed for a decisive move. The path of least resistance appears to be upward, a direction that would exploit the massive bearish positioning of the retail segment and could lead to a sharp, painful squeeze for those betting against the trend.
In the cash segment, Foreign Institutional Investors (FII) sold 634 cr , while Domestic Institutional Investors (DII) bought 2261 cr.
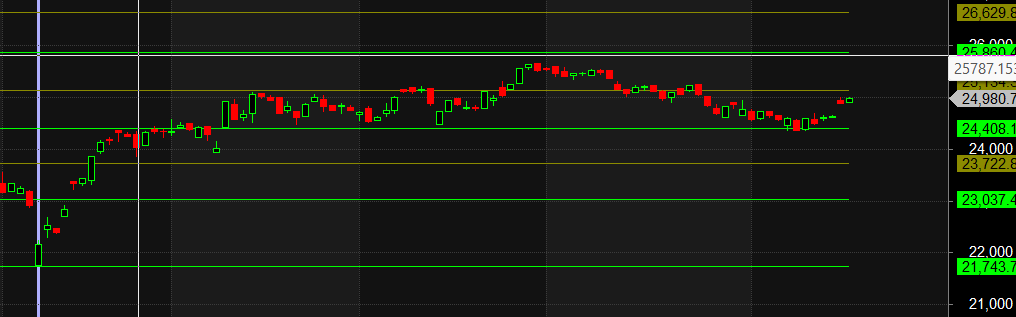
Traders who follow the musical octave trading path may find valuable insights in predicting Nifty’s movements. According to this path, Nifty may follow a path of 23037-23722-24408-25134-25860 This means that traders can take a position and potentially ride the move as Nifty moves through these levels.Of course, it’s important to keep in mind that trading is inherently risky and market movements can be unpredictable.
Doubling down does not work for the intraday trader. I have tried it. Eighty-five percent of the time you will profit when you double down. But the 15 percent of the time you are wrong, you will get smoked. The losses during these trades will far outweigh the gains from the 85%
For Positional Traders, The Nifty Futures’ Trend Change Level is At 24721 . Going Long Or Short Above Or Below This Level Can Help Them Stay On The Same Side As Institutions, With A Higher Risk-reward Ratio. Intraday Traders Can Keep An Eye On 25005, Which Acts As An Intraday Trend Change Level.
Nifty Intraday Trading Levels
Buy Above 24968 Tgt 25012, 25066 and 25108 ( Nifty Spot Levels)
Sell Below 24940 Tgt 24900, 24840 and 24777 (Nifty Spot Levels)
Wishing you good health and trading success as always.As always, prioritize your health and trade with caution.
As always, it’s essential to closely monitor market movements and make informed decisions based on a well-thought-out trading plan and risk management strategy. Market conditions can change rapidly, and it’s crucial to be adaptable and cautious in your approach.
► Join Youtube channel : Click here
► Check out Gann Course Details: W.D. Gann Trading Strategies
► Check out Financial Astrology Course Details: Trading Using Financial Astrology
► Check out Gann Astro Indicators Details: Gann Astro Indicators