


Astro-Trading Outlook for the Week Ahead: SENSEX
“Markets dance to the rhythm of the cosmos. The real art is timing your step.” — Gann-Inspired
We have a short 3-day trading week as Friday, 18 April 2025, is a trading holiday due to Good Friday.
Traders should be prepared for high volatility and potential trend reversals, as the sky is charged with several powerful astrological alignments. Understanding these celestial triggers can offer a unique trading edge—especially when combined with Gann and technical tools.
Highlighted Astro Events & Trading Implications
Below are the major planetary events influencing market momentum this week:
Mercury enters Aries – Expect increased volatility and aggressive intraday moves in banking and FMCG stocks.
Mars enters Leo – Fire meets fire. Action-oriented moves expected in metals, energy, and PSU banks.
Sun enters Taurus – Focus shifts to consumption, auto, and infrastructure-related stocks.
Mercury Conjunct Neptune – Be cautious of rumors and false breakouts; mental fog and miscommunication possible.
Jupiter Opposite Moon – Emotional sentiment can drive irrational price moves—stay grounded.
Mars Trine Neptune – Favorable for momentum in oil, pharma, and sugar stocks.
Venus Turns Direct – Positive for midcaps, real estate, and luxury-related sectors.
Mars at Maximum Distance from Sun – Can bring high-energy market reactions; monitor FII flows closely.
Mercury at Minimum Distance from Sun – Trigger for short-term trend reversals in indices.
Bayer Rule 7 Alert: “There are changes on the market when Venus or Mars goes over its Aphelium/Perihelium (Geocentric).”
This rule is in effect—expect unexpected momentum shifts, especially mid-week.
How to Trade This Week Using Astro-Gann Insights
Use planetary dates as time-triggers on your price charts.
Watch for key reversals near astro-events, especially in Nifty, Bank Nifty, and sector leaders.
Combine these with your Gann time cycles and support/resistance levels for high-probability setups.
Astro analysis can help identify trends and reversals in the market, and it can be used in combination with other technical analysis methods to improve the accuracy of trading strategies. Gann analysis involves studying charts and identifying support and resistance levels to pinpoint potential trading opportunities.
SENSEX Harmonic Pattern

Shark Pattern Completed heading towards 75946/77175 till holding 75083
SENSEX Gann Angles
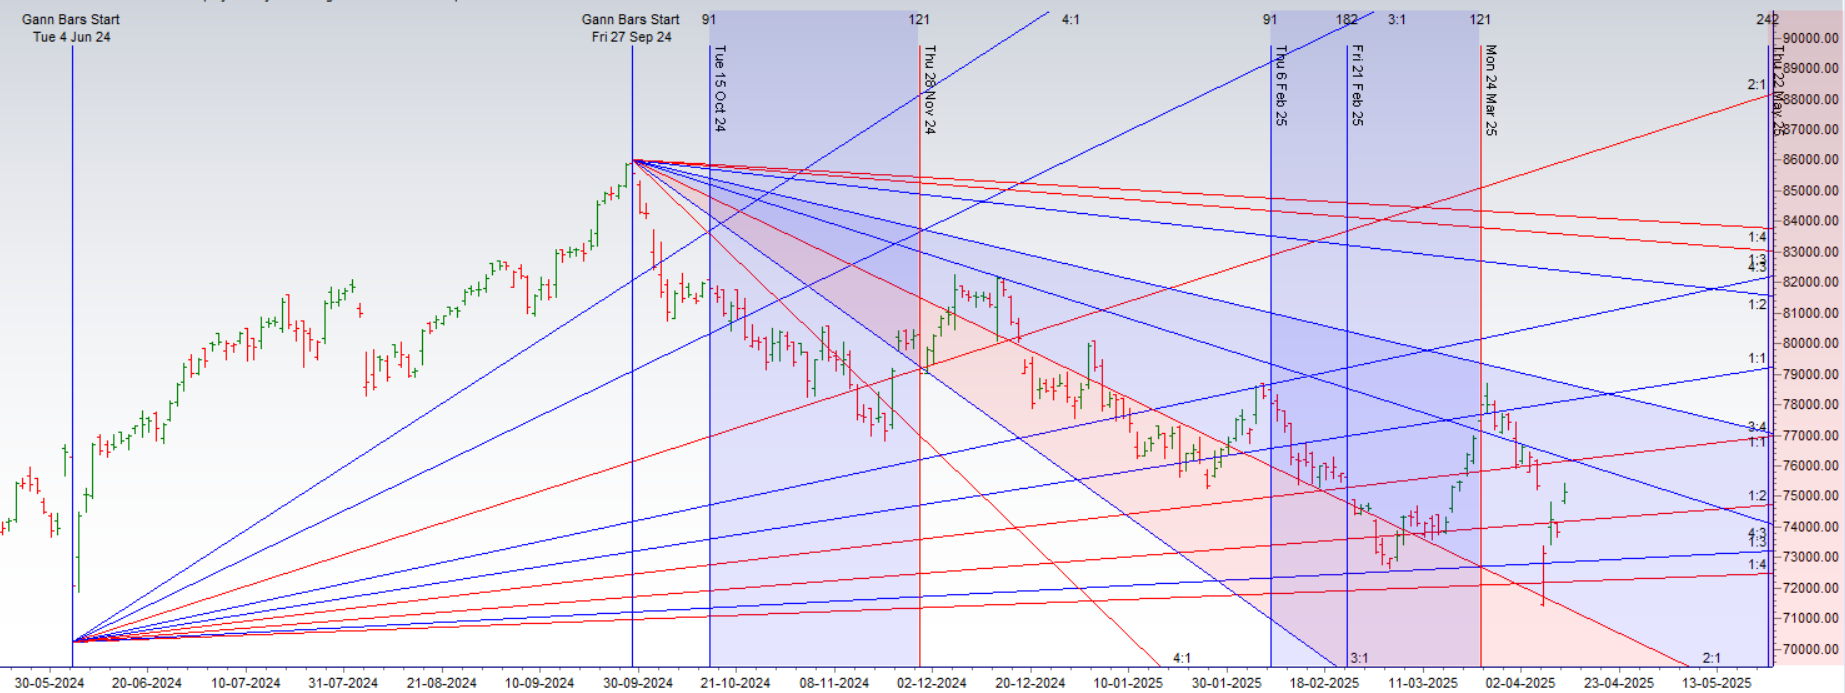
Price is heading towards 1×1 gann angle resistance zone of 76204
SENSEX Supply and Demand

Self Explanatory Chart
SENSEX Time Analysis Pressure Dates
17 April is the Important Gann/Astro Date for coming week.
SENSEX Weekly Chart

Price has formed Bullish Weekly Engulfing at AF support zone.
SENSEX Monthly Charts

76263 is Monthly resistance zone 73785 is Support zone.
SENSEX Weekly Levels
SENSEX Trend Deciding Level: 76130
SENSEX Resistance: 76403,76676,76950
SENSEX Support: 75856,75583,75309,75036
Learn More:
W.D. Gann Trading Strategies – Learn how to decode markets using price, time, and geometry.
Trading Using Financial Astrology – Discover how planetary motion impacts market behavior and how to trade it effectively.
Ready to Trade Like a Time-Master?
Join our one-on-one mentorship to master astro-timing, Gann analysis, and institutional-grade setups.
Call: 09985711341
Email: bhandaribrahmesh@gmail.com