


Infratel
Intraday Traders can use the below mentioned levels
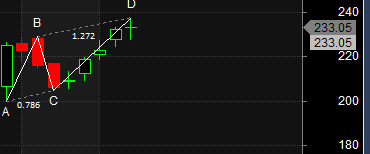
Buy above 234 Tgt 235.5, 237 and 239 SL 233
Sell below 232 Tgt 230.5, 229 and 227 SL 233
Asian Paint

Intraday Traders can use the below mentioned levels
Buy above 1752 Tgt 1766, 1780 and 1800 SL 1743
Sell below 1736 Tgt 1720, 1700 and 1680 SL 1745
SRT Finance

Intraday Traders can use the below mentioned levels
Buy above 685 Tgt 692, 698 and 707 SL 681
Sell below 678 Tgt 672, 666 and 656 SL 683
How to trade Intraday and Positional Stocks Analysis — Click on this link
Performance sheet for Intraday and Positional is discussed for May Month, Intraday Profit of 4.87 Lakh and Positional Profit of 4.78 Lakh. Please note we do not have any “ADVISORY Service”, I share this sheet to see how the system are performing and money can be made in Stock Market if Trading Systems are followed with discipline. Performance “Will differ” from trader to trader.
http://tradingsystemperformance.blogspot.in/
http://stockpositionaltrading.blogspot.in/
- All prices relate to the NSE Spot/Cash Market
- Calls are based on the previous trading day’s price activity.
- Intraday call is valid for the next trading session only unless otherwise mentioned.
- Stop-loss levels are given so that there is a level below/above, which the market will tell us that the call has gone wrong. Stop-loss is an essential risk control mechanism; it should always be there.
- Book, at least, part profits when the prices reach their targets; if you continue to hold on to positions then use trailing stops to lock in your profits.