


TECH M
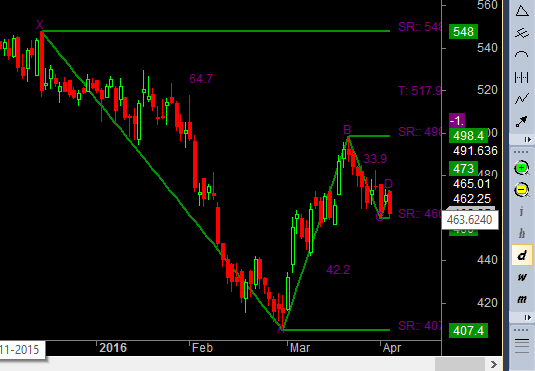
Positional/Swing Traders can use the below mentioned levels
Close above 466 Tgt 475/487/498
Intraday Traders can use the below mentioned levels
Buy above 466 Tgt 470,477 and 483 SL 462
Sell below 457 Tgt 452,448 and 444 SL 461
HDFC
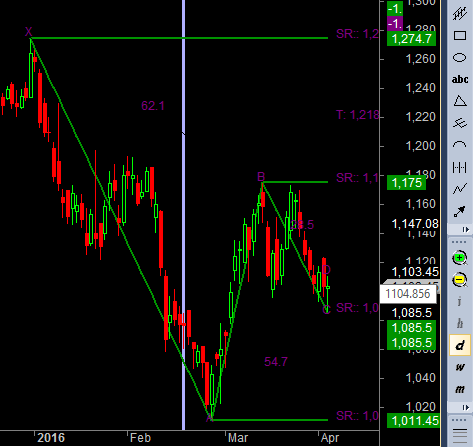
Positional/Swing Traders can use the below mentioned levels
Close above 1111 Tgt 1131/1175
Intraday Traders can use the below mentioned levels
Buy above 1105 Tgt 1111,1122 and 1131 SL 1099
Sell below 1095 Tgt 1089,1077 and 1068 SL 1100
TITAN
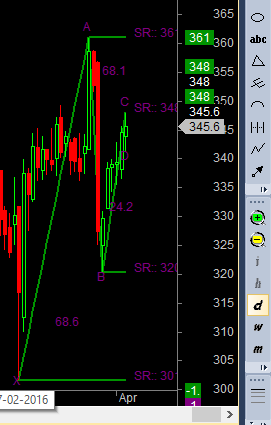
Positional/Swing Traders can use the below mentioned levels
Holding 343 Tgt 354/364
Intraday Traders can use the below mentioned levels
Buy above 346 Tgt 348.5,351 and 354 SL 344
Sell below 341.5 Tgt 339,336 and 333 SL 343
How to trade Intraday and Positional Stocks Analysis — Click on this link
Performance sheet for Intraday and Positional is updated for March Month, Intraday Profit of 3.22 Lakh and Positional Profit of 6.46 Lakh
http://tradingsystemperformance.blogspot.in/
http://stockpositionaltrading.blogspot.in/
- All prices relate to the NSE Spot/Cash Market
- Calls are based on the previous trading day’s price activity.
- Intraday call is valid for the next trading session only unless otherwise mentioned.
- Stop-loss levels are given so that there is a level below/above, which the market will tell us that the call has gone wrong. Stop-loss is an essential risk control mechanism; it should always be there.
- Book, at least, part profits when the prices reach their targets; if you continue to hold on to positions then use trailing stops to lock in your profits.
Follow on Facebook during Market Hours: https://www.facebook.com/pages/Brameshs-Tech/140117182685863
What kind of pattern is this called?
Developing Gratley pattern