


Asian Paint

Positional/Swing Traders can use the below mentioned levels
Close above 900 Tgt 932/953
Intraday Traders can use the below mentioned levels
Buy above 900 Tgt 906,913 and 920 SL 895
Sell below 893 Tgt 889,882 and 872 SL 897
Arvind
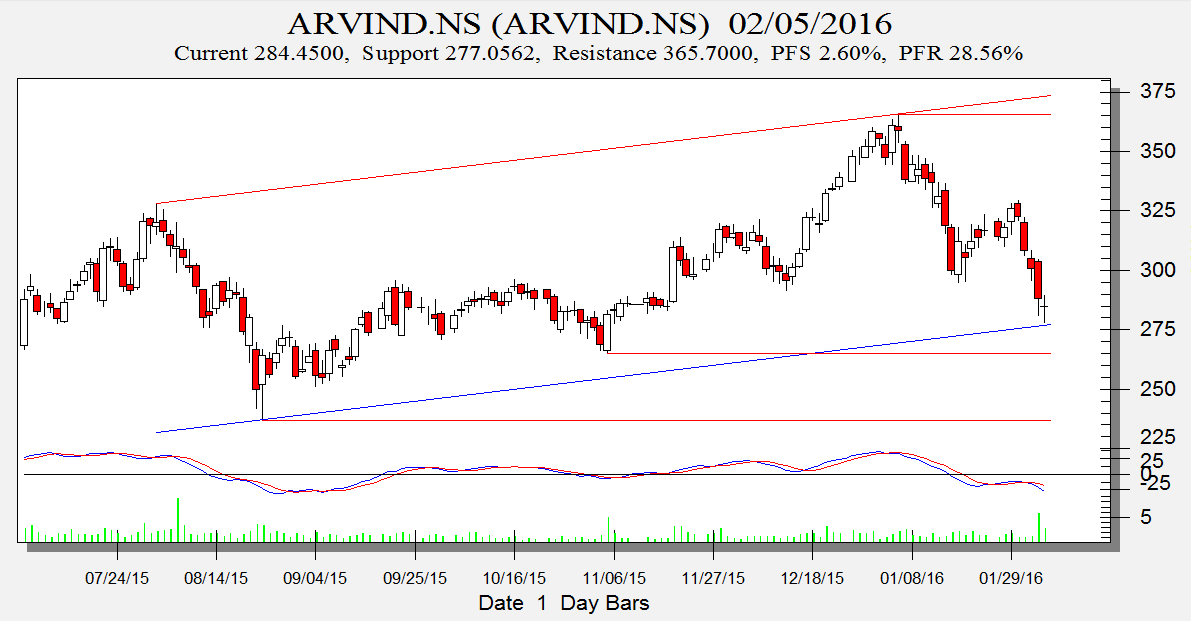
Close above 288 Tgt 305
Intraday Traders can use the below mentioned levels
Buy above 286 Tgt 289,296 and 301 SL 284
Sell below 283 Tgt 279,275 and 272 SL 284.5
Dabur

Positional/Swing Traders can use the below mentioned levels
Close above 254 Tgt 267
Intraday Traders can use the below mentioned levels
Buy above 252 Tgt 253.5,255.5 and 259 SL 249.5
Sell below 249 Tgt 247.5,244 and 241 SL 251
How to trade Intraday and Positional Stocks Analysis — Click on this link
Performance sheet for Intraday and Positional is updated for January Month, Intraday Profit of 3.57 Lakh and Positional Profit of 4.36 Lakh
http://tradingsystemperformance.blogspot.in/
http://stockpositionaltrading.blogspot.in/
- All prices relate to the NSE Spot/Cash Market
- Calls are based on the previous trading day’s price activity.
- Intraday call is valid for the next trading session only unless otherwise mentioned.
- Stop-loss levels are given so that there is a level below/above, which the market will tell us that the call has gone wrong. Stop-loss is an essential risk control mechanism; it should always be there.
- Book, at least, part profits when the prices reach their targets; if you continue to hold on to positions then use trailing stops to lock in your profits.
Follow on Facebook during Market Hours: https://www.facebook.com/pages/Brameshs-Tech/140117182685863
Follow on Twitter during Market Hours: https://twitter.com/brahmesh
Hi. Arvind saw a great move on Monday 8th Feb. But looking at the chart, hasn’t it formed a bearish head and shoulder pattern with it’s neckline around 295. It is still trading below it. In the medium term, don’t you see it headed much lower? Maybe around 260?
Yes if 310 is not crossed