There are three basic steps in spotting Harmonic Price Patterns:
- Step 1: Locate a potential Harmonic Price Pattern
- Step 2: Measure the potential Harmonic Price Pattern
- Step 3: Buy or sell on the completion of the Harmonic Price Pattern
By following these three basic steps, you can find high probability setups that will help you grab good profits.
How to trade ABCD Harmonic Pattern
Let’s see this process in action!
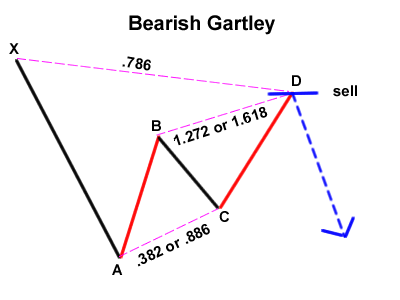
Gartley pattern has the following characteristics:
- Move AB should be the .618 retracement of move XA.
- Move BC should be either .382 or .886 retracement of move AB.
- Move CD should be 1.272 of move BC. if move BC is .786 of move AB, then CD should extend 1.618 of move BC.
- Move CD should be .786 retracement of move XA
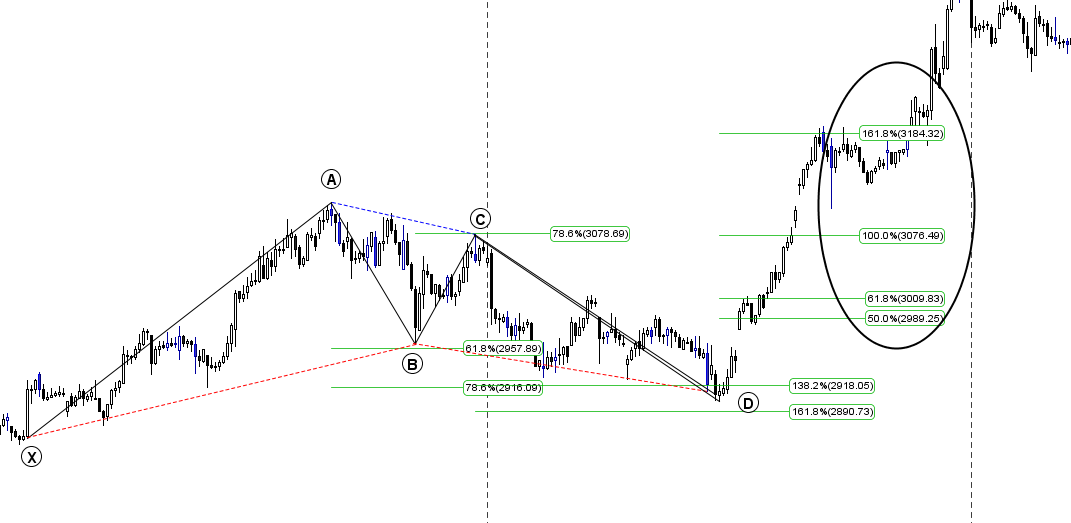
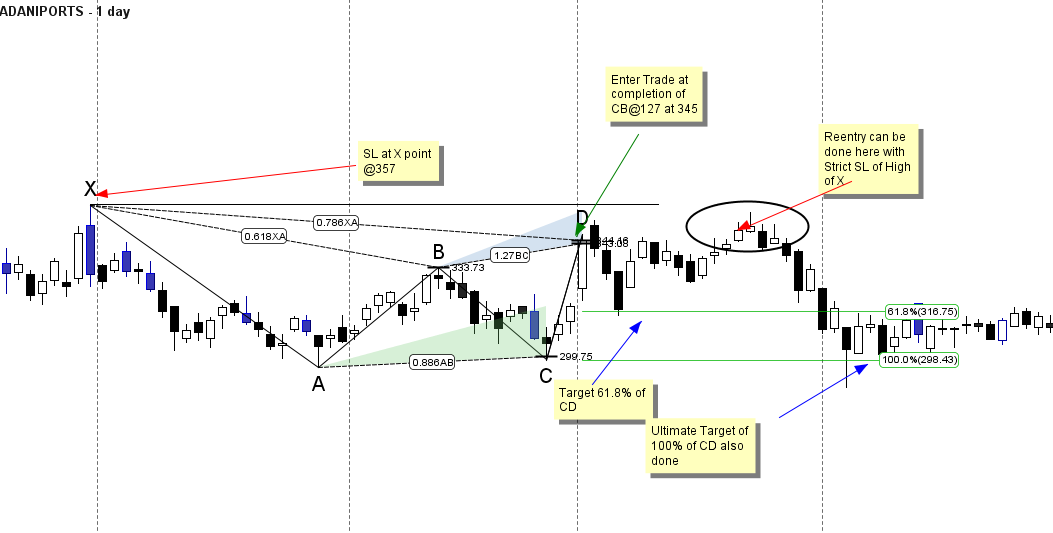
I have shown Daily chart of Adani Ports and marked the potential harmonic pattern in forming
I have shown Daily chart of Hindalco and marked the potential harmonic pattern in forming
I have shown Daily chart of Maruti and marked the potential harmonic pattern in forming 
Once the pattern is complete, all you have to do is respond appropriately with a buy or sell order.
This pattern can be hard to spot and once you do, it can get confusing when you apply Fibonacci ratios The key to avoiding all the confusion is to take things one step at a time.


sir,BC leg is mentioned as 0.382 or0.886. Some people people take 0.618 .kindly please clarify thank you.
and also what should be the target for that particular bearish or bullish pattern ??
Use fibo ratios
Sir,these patterns can be seen in 15mins,hourly and daily time scale.whether all those patterns can give same effect or only particular time scale will work
Daily chart patterns are more authentic. Brameshji to confirm.
Also, I feel, Once the pattern is complete, we have to respond appropriately with a buy or sell order.- only after the confirmation of trend with one full bearish or bullish candle.
Thanks for sharing your views .
Yes can be used on any time frame