There are certain characteristics of the markets that take place almost all the time, when the indexes are about to approach an intermediate or long-term top or long term bottom. In order of importance, this is what you have to look at to identify market tops.
- Time
- Sentiment
- Market Breadth
- Price patterns
- Valuations
- Time Profiles: Major tops/bottom are made after the markets have been going up/down for an extended long period of Time. Indian Market follow the 8 year cycle , Major Tops are formed after 8 year, 1992,2000,2008 have been the major tops in Indian market. We have formed a Major Top is March 2015 @9119 from where we have corrected till 7400 a correction of almost 20%. Any market which corrects more than 20% is technically in Bear market. But time alone will not give you the sufficient information you need to identify market tops/bottom. All of the key identities must be in place at or near major market tops/bottom.
- Sentiment: Bullish Sentiment will always be high at or near market tops and Bearish Sentiment near market Bottom . Have you noticed the sentiment for Banks stocks near Jan period, no one was talking about shorting banks stocks media was going “gung ho” about banks taking lead. 30 Jan 2015 was top formed in Bank Nifty. Extreme sentiment is always an attribute of a market turn or top but, by itself, is not a determinant of the turn. If we take current scenario Banking Stocks are getting butuchered specially the PSU Banking space.
Market Cap of PSU banks have almost taken a 30% Hit in last 15 days. Market cap of 16 PSU stocks is currently at 266549 core which is almost equivalent to Market cap of HDFC Bank.
Bearish sentiments in PSU Bank is at extreme the kind of Hit they are taking. Valuation goes for a toss during formation of market bottoms. One of the most difficult aspects of this methodology is to determine the degree or scale of the Market Sentiment or how big an extreme is being made. Often high sentiment only leads to pullbacks, but by merging the Sentiment Analysis with the Technicals, one can have a better grasp of this. Thus, if the Technicals are diverging or reversing on a daily as well as a Weekly basis, probabilities favor a more important change in the Sentiment and formation of major bottom.
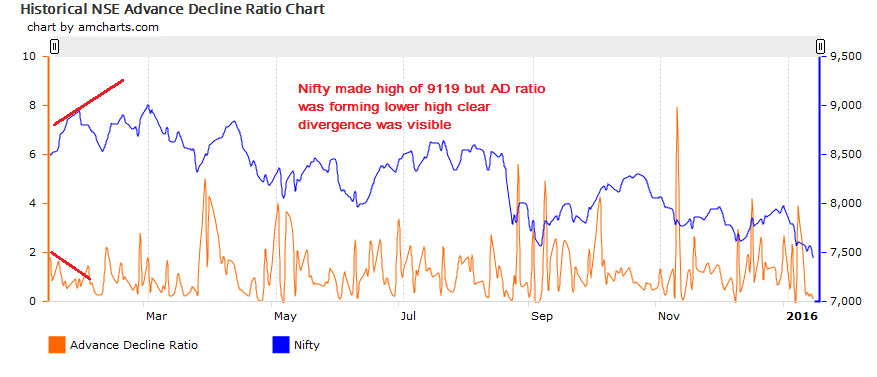
- Market Breadth. There are a number of ways to monitor the market breadth, but the one thing that has always marked market tops, is a divergence between the NSE AD (NSE Advance-Decline Issues) . A divergence is when the NIFTY heads to new highs as the NSE Advance and Decline fails to make a new high. This divergence has shown up at every market top during our 8 year time period.
The chart below illustrates these negative divergences during the High made of 04 March 2015 @9119. Nifty made the high but A?D failed to do catch up . Under current scenario we are not seeing any divergence. We have never had a true major top/bottom without this divergence.
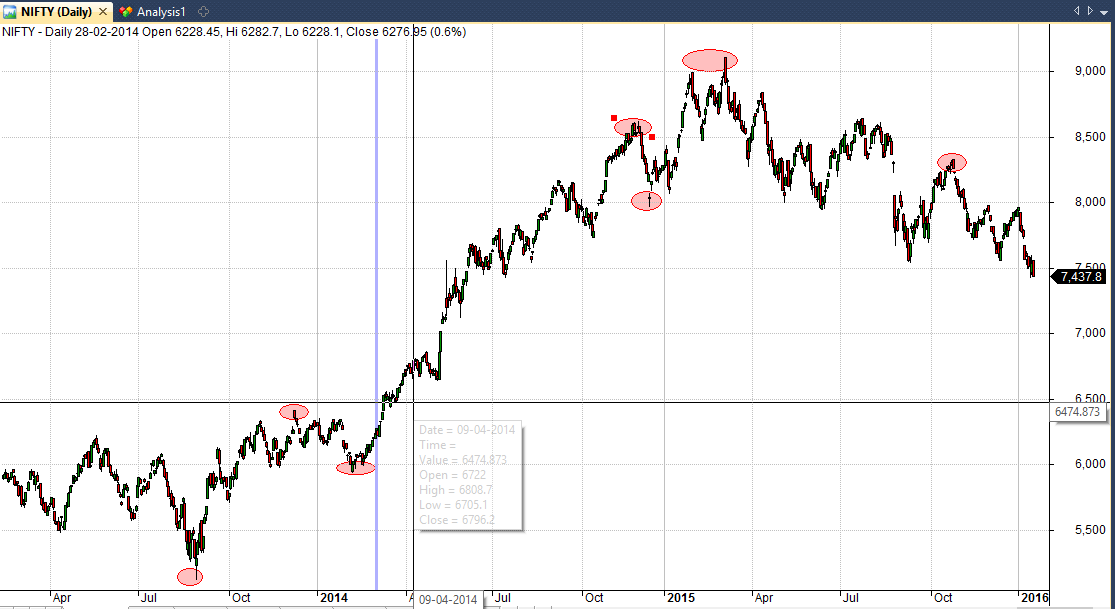
- Price and Price Patterns: There are certain price patterns that typically take place at market tops. Very rarely will you see a major top form from the exact last high. Tops are a process and take time to form. Once a top is in place, you will almost always see the bulls try and test that high again. When it fails to make a new high, that is when you can consider a major top is in place. Below is a chart of the NSE tops and Bottom.
Valuation
PE ratio plays also an important role in finding major top and bottom. Valuation above 24 are generally blow off and can get extended till 28 as in Jan 2008. Valuation near 16-17 generally act as short term bottom. Currently we are trading at valuation of 20.
When looking for major tops / bottom in the markets, all of the elements above must be in place. If one is missing, you must leave the door open that the major top is not in place yet.


Blindly wait for levels to reach and follow it to take positions with Stop Loss. This is the only way now . Also avoid overnight positions if you are not comfortable. Take less qty to avoid losses… Do not expect or hope for BANKNIFTY or NIFTY levels on expiry ..to happen this way or the other way
Thanks for sharing for your views.
Rgds,
Bramesh
Bramesh Sir Ji…my trading success is all because of your training and info posts like these…heavily indebted to you
Dear Rajiv sir,
Its your trading discipline and metal strength which are yielding results. I am very happy for you.
Rgds,
Bramesh
now we should check how to recognize bottom that will help us to grew
Sir if I m not wrong we are missing two elements in 2015 one is time n second is market breath so we still have hope to form top this year
i agree with your cycle analysis.. there are cycles in every stock market and every stock ! Sentiment is for sure a major indicator of market bottoms and tops.. right now i feel so much i had a US trading account.. i would have invested in stocks 🙂 🙂
Indian market.. people are way too bullish still.. I dont see the kind of headlines one would see( Gloom and doom). Hopefully it will be here soon and we make a long term bottom !!
Bank nifty and nifty are heading for a tremendous upmove , these are panic bottoms one should accumulate , Nifty can very well reach 7860 by expiry
Don’t give advises without justification
So sir are we in a bear market or we can bounce 600 points on nifty soon ?
Looks like BANKNIFTY is being used as prop to pull the premium money out of NIFTY, in either way, CE or PE. Now NIFTY puts 7400 has a damn tempting money sitting on it. Its too naive to leave it like that. There is more probability that BANKNIFTY will go up atleast on monday and a few more days to come.
So based on the 8 year cycle we should form a major top in 2016. Perhaps higher than 9119?
What is the extended pe ratio. below 16/17?
This is after long time even when positive diversion in rsi also not works n bank nifty keep on falling. On monday we feel bottom will made…on tuesday bottom is made…on wednesday bottom surely made…on thursday bottom in confirmed n on friday ohh my god…bottom is too far….
Totally agree to this view…..making notional loss due to this…monday either book and ride the wave; or if its a gap down and recovery, then hold….
This time it looks difficult to predict as banknifty is also extremely over sold also but same time there is heavy call writing also at 16000. At least in this series it looks difficult to cross 16000 right now. Every rise will be sold off and traders are waiting to short at any rise. May be its again danger to short it as big boys again trap you at opposite side.
Hey Guys, any intelligent guess whether the BANKNIFTY will expire [Jan28] at around 16000? Please take a hit and post your replies. From the past performance, BANKNIFTY always takes ONE solid up and ONE down in any expiry [some exception did exist] month.
That’s very informative, Thanks a lot.